Introduction
Once hazards and their associated risks have been identified, they should be assessed to determine the overall risk level presented by each hazard. This process begins before the flight using the process outlined in the previous chapter. While risk assessment may seem subjective at first, pilots can learn effective risk-management through routine practice and application.
Risk Assessment Components
Risk is the composite of the likelihood (probability) and the severity (consequences) of a particular outcome. Both likelihood and severity can vary in magnitude.
Risk Likelihood
The following terms describe the likelihood of an outcome:
- Probable–An event may occur several times.
- Occasional–An event may occur sometime.
- Remote–An event is unlikely to occur but is possible.
- Improbable–An event is highly unlikely to occur.
To illustrate, consider the likelihood of exceeding airframe structural limits if penetrating a thunderstorm. It is likely that the airframe’s structural limits would be exceeded each time this occurs, making the likelihood “probable.”
As another example, consider a case where a pilot operates at an airport surrounded by rough terrain. The runways are just long enough to accommodate the aircraft. The possibility exists for a runway overrun on each landing. Given this data, an overrun could occur sometime, and the likelihood is “occasional.”
Risk Severity
The following terms describe the severity of an outcome.
- Catastrophic–Results in fatalities and/or total airframe loss.
- Critical–Severe injury or major airframe or property damage.
- Marginal–Minor injury or minor airframe or property damage.
- Negligible–Less than minor injury or damage.
To illustrate, consider the example of penetrating a thunderstorm. A loss of control event exceeding airframe structural limits could result in either severe injuries or fatalities and airframe loss, creating either a “critical” or a “catastrophic” outcome.
In the example of the marginal runway length, an overrun could cause major damage to the aircraft and possible severe injuries, or a “critical” outcome.
Using a Risk Assessment Matrix
Once risk likelihood and severity have been determined, the pilot may use a tabular matrix to find the composite of these two parameters. [Figure 4-1]
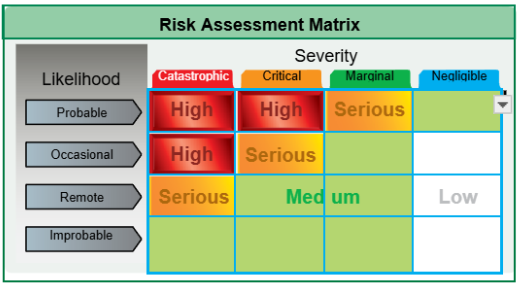
Figure 4-1. Risk Assessment Matrix.
Cross-matching the likelihood and severity on the matrix determines the composite risk. A thunderstorm penetration, with “catastrophic” severity and either “probable” or “occasional” likelihood, constitutes a high (red) risk level. The runway overrun, with “critical” severity and “occasional” likelihood, constitutes a serious (yellow) risk level.
The medium (green) risk level implies a “go” decision for a planned or ongoing flight. However, in this case, risk should still be mitigated if possible.
The high (red) or serious (yellow) categories imply “no-go” unless the pilot finds a means to reduce the risk, such that the next iteration of risk assessment indicates a medium or low risk.
Risk analysis should begin hours, days, or even weeks before a flight. For a simple flight, hours in advance may suffice. However, for a complex flight with multiple legs or a series of flights over several days, a pilot should begin to consider hazards and associated risks over an extended time period.
Matrix Errors
When assigning a risk level to a hazard using a matrix, the results could be subject to certain errors.
Accuracy
The matrix provides discrete results that depend on the accurate assignment of likelihood and severity. While conducting a risk assessment, a pilot may be unsure of the likelihood or severity for a particular risk or find it difficult to choose between adjacent parameters. In such cases, pilots should apply the more conservative parameter(s), which place the risk at a higher level. Pilots learning risk analysis should seek the opinion of a more experienced pilot or an instructor if there is any doubt as to the accuracy of inputs.
Skewing
Pilots sometimes use inputs that skew the risk toward a lower level due to the desire to complete a flight.
Obsolescence
The matrix results lose relevance if the hazards change before a flight departs. Pilots should verify and reevaluate their risk assessment based on current information and conditions before flight.
Case Study
Note: Refer to the case study section of Chapter 3 if needed.
Risk Assessment Analysis
The pilot, Tricia, identified nine separate hazards and associated risks that will affect a direct non-stop flight from Animas Air Park (00C) in Colorado to the Santa Rosa, California airport (KSTS). Now, she begins the process of assessing these risks using PAVE checklist elements.
Pilot
Tricia identified both capability and aeromedical risks. She concludes that reduced IFR proficiency means that a loss of control in-flight (LOC-I) event is possible although unlikely. A LOC-I event, especially in convection or icing conditions, could result in a fatal accident. A combination of “remote” likelihood and “catastrophic” severity indicates a serious (yellow) risk on the risk assessment matrix.
She also self-assessed her aeromedical risks using the IMSAFE checklist and identified alcohol and fatigue as potential hazards. The risks associated with these hazards could lead to multiple in-flight errors that could result in major damage or injury. Collectively, she assesses these risks as having “occasional” likelihood and “critical” severity. On the risk assessment matrix, this combination indicates a serious (yellow) risk. [Figure 4-2]
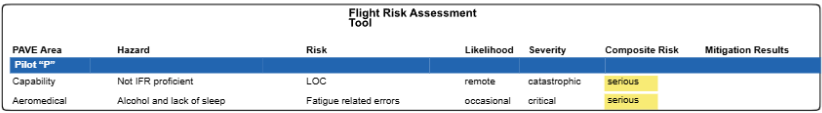
Figure 4-2. FRAT excerpt for pilot hazards and associated risks.
Aircraft
She identified three areas that pertain to aircraft-related risk. During a non-stop flight, the likelihood of fuel exhaustion increases if extensive deviation around weather is needed. Fuel exhaustion over rugged western terrain could result in a fatal accident. Her assessment results in a “remote” likelihood with “catastrophic” consequences, which indicate a serious (yellow) risk on the risk assessment matrix.
Tricia also noted that her aircraft is not approved for flight in known icing conditions and that a flight along the planned route might encounter icing conditions at some point. Even with an “occasional” likelihood, this could generate a CFIT or LOC-I event with fatalities, or “catastrophic” consequences, thus indicating a high (red) risk on the risk assessment matrix.
Finally, the aircraft may lack the performance needed to depart from the 5,000-foot runway at Animas Air Park. Having the Smiths on board, everyone’s baggage, and a reduced fuel load would result in a takeoff at the aircraft’s maximum gross weight of 2,740 pounds. The calculated takeoff distance would be 4,700 feet, and using her 20 percent safety factor produces a desired runway length of 5,640 feet, which exceeds the available runway distance. Under these conditions, Tricia determines that an overrun is possible at least some of the time and could cause major damage or severe injuries. This “occasional” likelihood and “critical” severity produces a serious (yellow) risk level from the risk assessment matrix. [Figure 4-3]

Figure 4-3. FRAT excerpt for aircraft hazards and associated risks.
Environment
She identified three areas with environment-related risk. The weather hazards on the direct route to Santa Rosa include thunderstorms, icing, and low ceilings. There could be severe turbulence in the convective activity, which covers most of the route and poses at least an upset potential at some time, producing an “occasional” likelihood. An upset in severe turbulence
could result in a LOC-I event and “catastrophic” fatal accident. The “occasional” likelihood and “catastrophic” severity indicate a high (red) risk on the risk assessment matrix.
Tricia’s original proposed route traverses some very high and rugged terrain. If she were to attempt to fly under the low ceilings and weather, the terrain would be a hazard with an associated CFIT risk. A CFIT event, while unlikely for a pilot with her experience, would still be possible and could result in fatalities. This “remote” likelihood and “catastrophic” severity indicate a serious (yellow) risk on the risk assessment matrix.
The Animas Air Park elevation of 6,684 feet combined with July temperatures result in a high density altitude, which constitutes a hazard. The combination of high density altitude and high terrain in the area could lead to a “catastrophic” CFIT accident. This could occur at least sometime or with “occasional” likelihood. The combination of “occasional” likelihood and “catastrophic” severity indicate a high (red) risk on the risk assessment matrix.
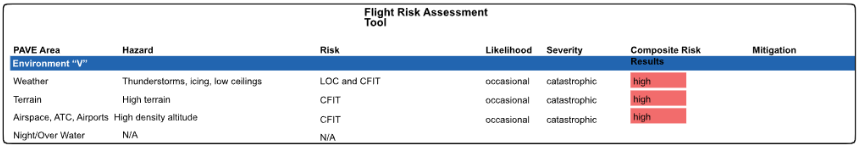
Figure 4-4. FRAT excerpt for environment hazards and associated risks.
Both Tricia and Martha face pop-up business events that appear to be critical, and Tricia has agreed to provide a solution to their transportation requirement.
Tricia feels the pressure to get to Santa Rosa before the Tuesday meeting. The Smiths are good friends, and she does not want to disappoint them. She feels additional pressure because the Smiths are expected to officiate at the Independence Day festivities and wish to attend parties that night. They may not be aware of any reason why Tricia could not depart early on Tuesday and get to Santa Rosa in time for their meetings using a single-engine GA airplane.
She concludes that external pressures are magnifying the identified risks, indicating a “probable” likelihood and “catastrophic” severity with high (red) risk levels.
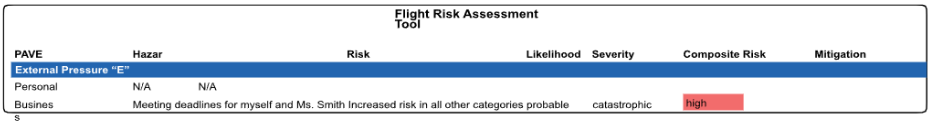
Figure 4-5. FRAT Excerpt for external pressure hazards and associated risks.
She finishes recording her risk assessment analysis [Figure 4-6] and begins determining ways to mitigate the risks (see the case study section in Chapter 5, Mitigating Risk). She will soon need to discuss the next steps with the Smiths.
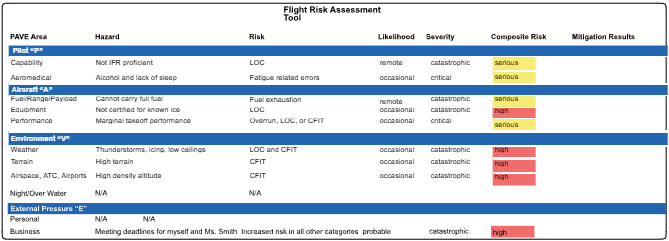
Figure 4-6. FRAT hazards and associated risks.
Chapter Summary
Risk assessment is a critical element in the risk analysis process. To determine overall risk levels, the pilot assesses both risk likelihood and risk severity for all identified hazards. The primary tools for this process are the FRAT and the risk assessment matrix. A pilot’s risk assessment accuracy should improve with practice.


