The fifth of five types of aviation weather information discussed in this handbook is aviation weather tools. Aviation weather tools are web-based applications that incorporate multiple weather products into a web-based interactive display.
This chapter will describe three web-based interactive displays: the GFA Tool, the Flight Service’s Interactive Map, and the Helicopter Emergency Medical Services (HEMS) Tool.
This chapter describes these web-based displays as they are configured in 2022. Enhancements to these displays will likely occur in the coming years as technology improves. Users will find information on any enhancements on the providers’ websites.
Note: The AWC Flight Path Tool is not included in this handbook since the NWS plans to retire this web-based tool.
Graphical Forecasts for Aviation (GFA) Tool
The GFA Tool is a set of web-based displays intended to provide the necessary aviation weather information to give users a complete picture of the weather that may impact their flight operations. It is a one-stop shop for multiple data fields. The AWC website includes observational data, forecasts, and advisories including thunderstorms, clouds, flight category, precipitation, icing, turbulence, and wind. Hourly model data and forecasts, including information on clouds, flight category, precipitation, icing, turbulence, wind, and graphical output from the NWS’ NDFD, are available. Built with modern geospatial information tools, users can pan and zoom to focus on areas of greatest interest. An example is seen in Figure 28-1.
Descriptions of the observations, forecasts, and advisories that are used in the GFA Tool have been presented in other chapters within this handbook. This section does not show or describe the many possible overlays for the GFA Tool, since the AWC has produced a very thorough and complete description under the “Info” tab on the AWC’s GFA Tool website, which also includes a tutorial video. In addition, the GFA Tool will continue to be enhanced; therefore, users will be assured of being informed of the latest GFA Tool information by referring to the “Info” tab on AWC’s GFA Tool website.
Caution should be applied as users configure the GFA Tool for use. Users can turn on and turn off certain functions (e.g., AIRMET and SIGMET overlays for a given geographical area). This can lead to hidden areas of hazardous weather for a given flightpath.
Currently, the GFA Tool covers the CONUS, the Gulf of Mexico, the Caribbean, portions of the Atlantic Ocean, and portions of the Pacific Ocean, including the Hawaiian Islands and Alaska. The experimental GFA Tool became available for Alaska in December 2020 and transitioned into operational status in February 2022.
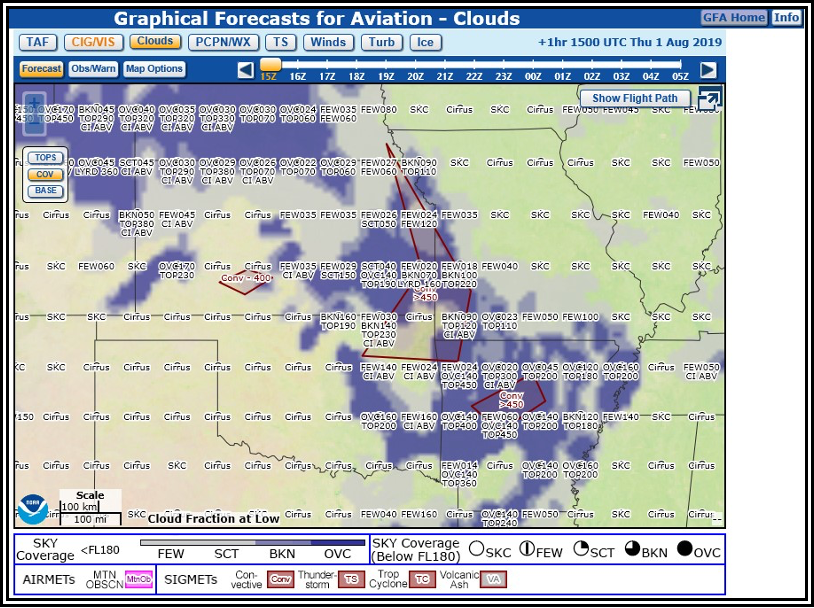
Figure 28-1. GFA Aviation Forecast for Clouds—Example
GFA Static Images
Some users with limited internet connectivity may access static images via the AWC’s website as well as from Flight Service’s website (see Appendix G, Websites). There are two static graphical images available titled, “Aviation Clouds Forecast” and “Aviation Surface Forecast.” See Section 27.4 for more information.
FAA Flight Service’s Interactive Map
Similar in presentation and functionality to the GFA Tool for weather data and products is the interactive map on Flight Service’s website. It provides users with interactive graphical capabilities to view a variety of weather and aeronautical information. Users logged in to the website are able to enter basic route information to display the flightpath on the map. Two primary types of weather information can be displayed on the map: overlay data and weather imagery.
Overlay data includes the following and can be displayed simultaneously:
- Winds aloft,
- METARs,
- TAFs,
- PIREPs,
- SIGMETs,
- AIRMETs,
- CWAs, and
- NWS’ severe weather watches and warnings.
Weather imagery includes the following and can only be displayed one product at a time:
- Radar (NEXRAD precipitation),
- Satellite, • CIP/FIP, and
- GTG.
Certain products will enable additional controls, such as an FL slider, a time slider, and animation controls.
Information on the above products and imagery is presented in other chapters of this handbook, as well as in the User Guide provided on Flight Service’s website.
Helicopter Emergency Medical Services (HEMS) Tool
The HEMS Tool overlays multiple fields of interest: ceiling, visibility, flight category, winds, relative humidity, temperature, icing, satellite, radar (Base and Composite Reflectivity), AIRMETs, SIGMETs, METARs, TAFs, and PIREPs. Data including temperature, relative humidity, winds, and icing potential is interpolated to AGL altitudes and can be sliced horizontally on 1,000-ft intervals up to 5,000 ft.
The display includes a rolling 2-hour archive of observed data (with 15-minute intervals) and hourly forecasts out to 6 hours. Overlays include roads, NAVAIDs, airports, and heliports for the entire United States. More detail is revealed as you zoom in, and individual layers can be turned on or off independently.
Additional information, including a tutorial, can be found on the AWC’s website.
Note: The NWS plans to replace the HEMS Tool with the next upgrade of the GFA Tool. This upgrade will have a Low Altitude mode that focuses on the 1- to 5-hour timeframe and altitudes up to 5,000 ft AGL.
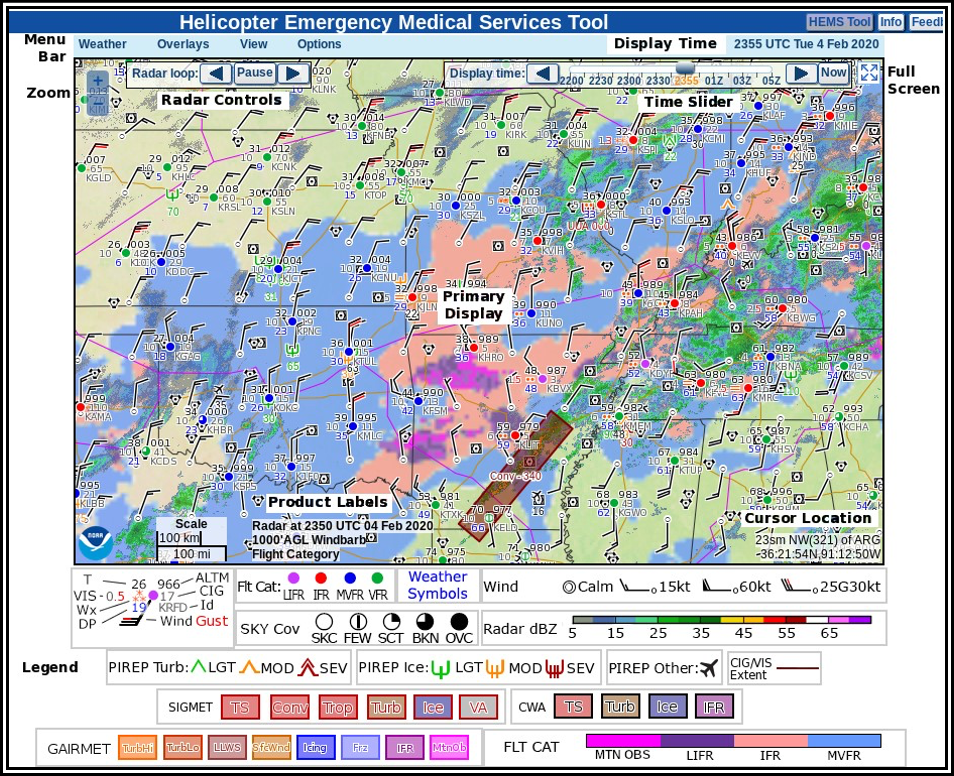
Figure 28-2. HEMS Tool—Example


