The fourth of five types of aviation weather information discussed in this handbook is forecasts.
This chapter will discuss many forecast products produced primarily by the NWS that are either specific to aviation or are public products of interest to aviation users.
As with other products discussed in this handbook, the visualization of these products has evolved over the past decade with the use of internet websites. The use of static black and white depictions of aviation forecasts is almost a thing of the past. Today’s websites provide the forecast products in color and offer options to select and overlay multiple products.
Today’s aviation weather websites, including those of the NWS, continue to improve the content and visualization of forecast products. Unfortunately, it is not practical to update this handbook with every change to a weather product.
Examples of weather products in this handbook represent one way of how they can be visualized on a user’s viewing device (e.g., computer, tablet, mobile phone, or cockpit display). The examples shown in this handbook are from the NWS’ websites.
For this handbook, forecasts include the following:
- Winds and Temperatures Aloft Forecasts.
- Terminal Aerodrome Forecasts (TAF).
- Aviation Surface Forecasts.
- Aviation Clouds Forecasts.
- Area Forecasts (FA): o Alaska FA. o Hawaii FA. o Gulf of Mexico FA. o Caribbean FA.
- Alaska Graphical Forecasts:
- Flying Weather. o Surface Forecast. o Icing Forecast. o Turbulence Forecast.
- Convective Outlook.
- World Area Forecast System (WAFS) Forecasts.
- Significant Weather (SIGWX) Forecasts:
- Low-Level. o Mid-Level.
- High-Level.
- Surface Prognostic Forecasts.
- Upper-Air Forecasts.
- Freezing Level Forecasts.
- Forecast Icing Product (FIP).
- Graphical Turbulence Guidance (GTG) Forecasts.
- Cloud Tops Forecasts.
- Localized Aviation Model Output Statistics (MOS) Program (LAMP) Forecasts.
- Alaska Aviation Guidance (AAG) Weather Product.
- Additional Convection Products:
- Convective Outlook.
- Traffic Flow Management (TFM) Convective Forecast (TCF). o Extended Convective Forecast Product (ECFP). o Watch Notification Messages.
- Route Forecasts (ROFOR).
- Aviation Forecast Discussions (AFD).
- Meteorological Impact Statements (MIS).
- Soaring Forecasts.
- Balloon Forecasts.
Winds and Temperatures Aloft
There are many wind and temperature aloft forecasts and products produced by the NWS. Each NWP model (i.e., sometimes referred to as computer models) outputs wind and temperature at multiple levels. The primary output of these forecasts is a gridded binary code format intended for use in flight planning software.
There is no official wind and temperature aloft model for flight planning. Depending on the computer model, the validity times, time intervals, and altitude levels will vary. Some models produce wind and temperature forecasts at hourly time-steps while others produce forecasts at 6-hour time steps. A few models provide wind forecasts at 1,000-ft altitude levels while others are mostly at 3,000-ft altitude levels. The data points (location) will also vary depending on the source.
Because each computer model is based on different algorithms and physics, the wind and temperature forecasts will vary from model to model. These differences are due, in part, to the model’s forecast pressure patterns on the surface and aloft. In addition, some models have more detailed terrain as well as finer spacing between data points.
For many years there was just one set of wind and temperature forecasts, known as the FD Winds (then later as the FB Winds), which were presented in a coded text table format
Today’s flight planning software directly imports wind and temperature data from various computer models, which has effectively made the coded text table format obsolete.
Although FB winds are still produced today, they are archaic compared with model output available to the pilot and flight planner. FB winds:
- Are updated only four times daily, so winds that differ from the forecast are not updated for up to 6 hours.
- Provide a single value for each of three broad periods of time: from issuance time through 7 hours, 7 hours through 16 hours, and 16 hours through 28 hours.
- Provide a value at scattered locations in the country separated by about 100 to 150 mi.
In contrast, for example, the NWS’ Rapid Refresh model winds (available on the AWC GFA Tool):
- Are updated every hour based partly on automated wind reports from airliners.
- Provide a wind forecast for each hour into the future.
- Provide values at grid points separated by as low as 9 mi (at full zoom on the GFA Tool).
This section describes the details of the FB Wind and Temperature Aloft Forecast product. Other sections within this handbook provide additional wind and temperature aloft forecasts (i.e., constant pressure level forecasts and the global wind and temperature forecasts provided under the WAFS
FB Wind and Temperature Aloft Forecast
FB Wind and Temperature Aloft Forecasts are computer-prepared forecasts of wind direction, wind speed, and temperature at specified times, altitudes, and locations.
FB Wind and Temperature Aloft Forecast Issuance
The NWS NCEP produces scheduled FB Wind and Temperature Aloft Forecasts four times daily for specified locations in the CONUS, the Hawaiian Islands, Alaska and coastal waters, and the western Pacific Ocean. Specified locations are documented on the AWC’s website under “Winds/Temps” forecasts.
Amendments are not issued to the forecasts. Wind forecasts are not issued for altitudes within 1,500 ft of a location’s elevation. Temperature forecasts are not issued for altitudes within 2,500 ft of a location’s elevation.
FB Wind and Temperature Aloft Forecast Text Format
The text format for the FB Wind and Temperature Aloft Forecast uses the symbolic form DDff+TT in which DD is the wind direction (true), ff is the wind speed, and TT is the temperature.
Wind direction is indicated in tens of degrees (two digits) with reference to true north and wind speed is given in knots (two digits). Light and variable wind or wind speeds of less than 5 kt are expressed by 9900. Forecast wind speeds of 100 through 199 kt are indicated by adding 50 to the first two digits of the wind direction and subtracting 100 from the speed. For example, a forecast of 250°, 145 kt, is encoded as 7545. Forecast wind speeds of 200 kt or greater are indicated as a forecast speed of 199 kt. For example, 7799 is decoded as 270° at 199 kt or greater.
Temperature is indicated in degrees Celsius (two digits) and is preceded by the appropriate algebraic sign for the levels from 6,000 through 24,000 ft. Above 24,000 ft, the sign is omitted since temperatures are always negative at those altitudes.
The product header includes the date and time observations were collected, the forecast valid date and time, and the time period during which the forecast is to be used.
FB Wind and Temperature Aloft Forecast Coding Example
Sample winds aloft text message:
DATA BASED ON 010000Z
VALID 010600Z FOR USE 0500-0900Z. TEMPS NEG ABV 24000 FT 3000 6000 9000 12000 18000 24000 30000 34000 39000
MKC 9900 1709+06 2018+00 2130-06 2242-18 2361-30 247242 258848 550252 Sample message decoded:
DATA BASED ON 010000Z
Forecast data is based on computer forecasts generated the 1st day of the month at 0000 UTC.
VALID 010600Z FOR USE 0500-0900Z. TEMPS NEG ABV 24000
The valid time of the forecast is the 1st day of the month at 0600 UTC. The forecast winds and temperatures are to be used between 0500 and 0900 UTC. Temperatures are negative above 24,000 ft.
FT 3000 6000 9000 12000 18000 24000 30000 34000 39000
FT indicates the altitude of the forecast.
MKC 9900 1709+06 2018+00 2130-06 2242-18 2361-30 247242 258848 550252
MKC indicates the location of the forecast. The rest of the data is the wind and temperature aloft forecast for the respective altitudes.
Table 27-1 shows data for MKC (Kansas City, MO). Table 27-2 provides the time periods for the use of FB Wind and Temperature Forecasts.
Table 27-1. Wind and Temperature Aloft Forecast Decoding Examples
| FT 3000 6000 9000 12000 18000 24000 30000 34000 39000 MKC 9900 1709+06 2018+00 2130-06 2242-18 2361-30 247242 258848 550252 | |||
| Altitude (ft) | Coded | Wind | Temperature (˚C) |
| 3,000 ft | 9900 | Light and variable | Not forecast |
| 6,000 ft | 1709+06 | 170° at 9 kt | +06 °C |
| 9,000 ft | 2018+00 | 200° at 18 kt | Zero °C |
| 12,000 ft | 2130-06 | 210° at 30 kt | -06 °C |
| 18,000 ft | 2242-18 | 220° at 42 kt | -18 °C |
| 24,000 ft | 2361-30 | 230° at 61 kt | -30 °C |
| 30,000 ft | 247242 | 240° at 72 kt | -42 °C |
| 34,000 ft | 258848 | 250° at 88 kt | -48 °C |
| 39,000 ft | 750252 | 250° at 102 kt | -52 °C |
Table 27-2. Wind and Temperature Aloft Forecast Periods
| Model Run | Product Available | 6-Hour Forecast | 12-Hour Forecast | 24-Hour Forecast | |||
| Valid | For Use | Valid | For Use | Valid | For Use | ||
| 0000Z | ~0200Z | 0600Z | 0200-0900Z | 1200Z | 0900-1800Z | 0000Z | 1800-0600Z |
| 0600Z | ~0800Z | 1200Z | 0800-1500Z | 1800Z | 1500-0000Z | 0600Z | 0000-1200Z |
| 1200Z | ~1400Z | 1800Z | 1400-2100Z | 0000Z | 2100-0600Z | 1200Z | 0600-1800Z |
| 1800Z | ~2000Z | 0000Z | 2000-0300Z | 0600Z | 0300-1200Z | 1800Z | 1200-0000Z |
Graphical FB Wind and Temperature Aloft Forecast
Graphical depictions of FB Wind and Temperature Aloft Forecasts vary depending on the website. Details and information on these graphical depictions can usually be found on the website’s help or information page.
The AWC’s website provides an interactive display of the FB Wind and Temperature Aloft Forecasts (see Figure 27-1). As mentioned earlier, AWC’s GFA Tool provides very high-resolution wind forecasts from the NWS’ Rapid Refresh model (see Figure 27-2).
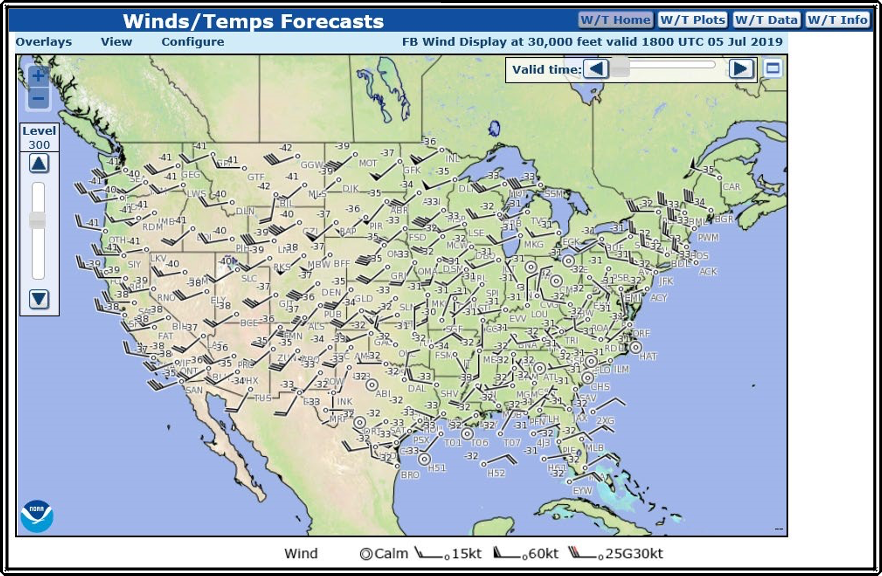
Figure FB Wind and Temperature Aloft Interactive Display Example
The interactive graphic in Figure 27-1 depicts wind speed (knots) and direction (referenced to true north) using standard windbarb display. Temperature (Celsius) is placed to the upper left of the station circle.
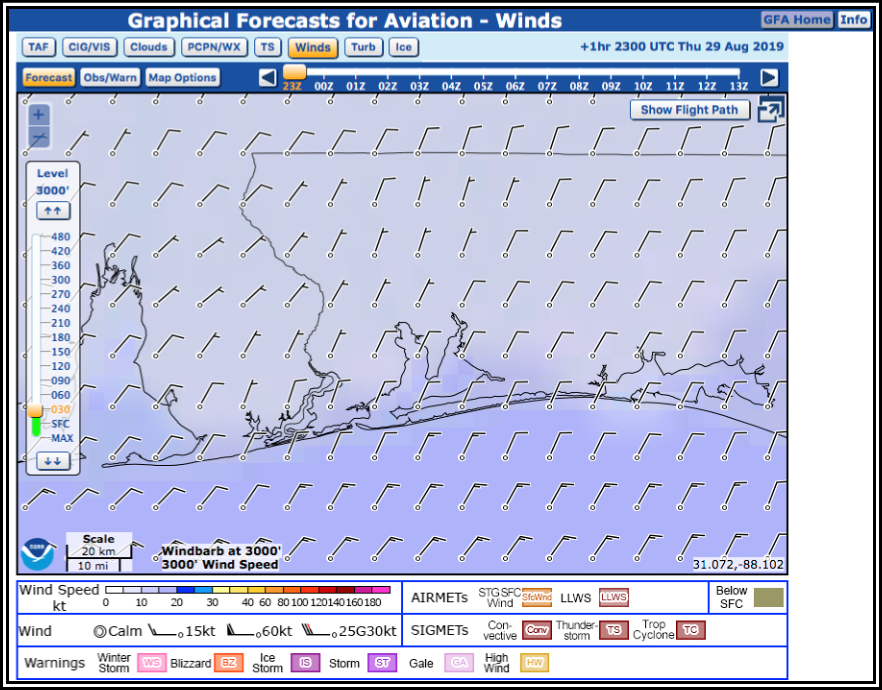
Figure Example of the GFA Tool Wind Aloft Forecast Display at 3,000 ft Zoomed in Over Pensacola, FL
Terminal Aerodrome Forecast (TAF)
A TAF is a concise statement of the expected meteorological conditions significant to aviation for a specified time period within 5 sm of the center of the airport’s runway complex (terminal). TAFs use the same weather codes found in METARs (see Section 24.3).
TAF Responsibility
TAFs are issued by NWS WFOs for nearly 700 U.S. airports. The majority of TAFs provide a 24-hour forecast for the airport, while TAFs for some major airports provide a 30-hour forecast.
Generic Format of the Forecast Text of an NWS-Prepared TAF
Refer to Table 27-3 for the generic format of the NWS’ TAFs.
Table 27-3. Generic Format of the National Weather Service’s TAFs
| TAF or TAF AMD or TAF COR | |||
| Type of report | |||
| CCCC | YYGGggZ Y1Y1G1G1/Y2Y2G2G2 dddffGfmfmKT | ||
| Location identifier | Date/time of forecast Valid period Wind group origin group | ||
| VVVV | w’w’ NsNsNshshshs WShwshwshws/dddftKT or or NSW VVhshshs or SKC | ||
| Visibility group | Significant weather Cloud and vertical Nonconvective LLWS group group obscuration groups | ||
| TTGGgg Forecast change indicator groups | |||
| FMY1Y1GGgg | TEMPO Y1Y1GG/YeYeGeGe PROB30 Y1Y1GG/YeYeGeGe | ||
| From group | Temporary group Probability group | ||
Type of Report (TAF, TAF AMD, or TAF COR)
The report-type header always appears as the first element in the TAF and is produced in three forms: a routine forecast (TAF), an amended forecast (TAF AMD), or a corrected forecast (TAF COR).
TAFs are amended whenever they become, in the forecaster’s judgment, unrepresentative of existing or expected conditions, particularly regarding those elements and events significant to aircraft and airports. An amended forecast is identified by TAF AMD (in place of TAF) on the first line of the forecast text.
Select airports have amendments routinely issued. See Table 27-7.
Location Identifier (CCCC)
After the line containing either TAF, TAF AMD, or TAF COR, each TAF begins with its four-letter ICAO location identifier.
Examples:
KDFW Dallas-Fort Worth
PANC Anchorage, Alaska
PHNL Honolulu, Hawaii
Date/Time of Forecast Origin Group (YYGGggZ)
The date/time of the forecast origin group (YYGGggZ) follows the terminal’s location identifier. It contains the day of the month in two digits (YY) and the time in four digits (GGgg in hours and minutes) in which the forecast is completed and ready for transmission, with a Z appended to denote UTC. This time is entered by the forecaster. A routine forecast, TAF, is issued 20 to 40 minutes before the beginning of its valid period.
Examples:
061737Z
The TAF was issued on the 6th day of the month at 1737 UTC.
121123Z
The TAF was issued on the 12th day of the month at 1123 UTC.
Valid Period (Y1Y1G1G1/Y2Y2G2G2)
The TAF valid period (Y1Y1G1G1/Y2Y2G2G2) follows the date/time of the forecast origin group. Scheduled 24- and 30-hour TAFs are issued four times per day, at 0000, 0600, 1200, and 1800Z. The first two digits
(Y1Y1) are the day of the month for the start of the TAF. The next two digits (G1G1) are the starting hour (UTC). Y2Y2 is the day of the month for the end of the TAF, and the last two digits (G2G2) are the ending hour (UTC) of the valid period. A forecast period that begins at midnight UTC is annotated as 00. If the end time of a valid period is at midnight UTC, it is annotated as 24. For example, a 00Z TAF issued on the 9th of the month and valid for 24 hours would have a valid period of 0900/0924.
Whenever an amended TAF (TAF AMD) is issued, it supersedes and cancels the previous TAF. That is, users should not wait until the start of the valid period indicated within the TAF AMD to begin using it. Examples
1512/1612
The TAF is valid from the 15th day of the month at 1200 UTC until the 16th day of the month at 1200 UTC.
2306/2412
This is a 30-hour TAF valid from the 23rd day of the month at 0600 UTC until the 24th day of the month at 1200 UTC.
0121/0218
This is an amended TAF valid from the 1st day of the month at 2100 UTC until the 2nd day of the month at 1800 UTC.
0600/0624
This TAF is valid from the 6th day of the month at 0000 UTC until the 6th day of the month at 2400 UTC (or 7th day of the month at 0000 UTC).
Wind Group (dddffGfmfmKT)
The initial time period and any subsequent “from” (FM) groups begin with a mean surface wind forecast (dddffGfmfmKT) for that period. Wind forecasts are expressed as the mean three-digit direction (ddd, relative to true north) from which the wind is blowing, rounded to the nearest 10°, and the mean wind speed in knots (ff) for the time period. If wind gusts are forecast (gusts are defined as rapid fluctuations in wind speeds with a variation of 10 kt or more between peaks and lulls), they are indicated immediately after the mean wind speed by the letter G, followed by the peak gust speed expected. KT is appended to the end of the wind forecast group. Any wind speed of 100 kt or more will be encoded in three digits. Calm winds are encoded as 00000KT.
The prevailing wind direction is forecast for any speed greater than or equal to 7 kt. When the prevailing surface wind direction is variable (variations in wind direction of 30° or more), the forecast wind direction is encoded as VRBffKT. Two conditions where this can occur are very light winds and convective activity. Variable wind direction for very light winds must have a wind speed of 1 to 6 kt inclusive. For convective activity, the wind group may be encoded as VRBffGfmfmKT, where Gfmfm is the maximum expected wind gusts. VRB is not used in the nonconvective LLWS group.
Squalls are forecast in the wind group as gusts (G) but must be identified in the significant weather group with the code SQ.
Examples:
23010KT
Wind from 230° “true” (southwest) at 10 kt.
28020G35KT
Wind from 280° “true” (west) at 20 kt gusting to 35 kt.
VRB05KT
Wind variable at 5 kt.
VRB15G30KT
Wind variable at 15 kt gusting to 30 kt due to forecast convective activity.
00000KT
Wind calm.
Visibility Group (VVVV)
The initial time period and any subsequent FM groups include a visibility forecast (VVVV) in statute miles appended by the contraction SM.
When the prevailing visibility is forecast to be less than or equal to 6 sm, one or more significant weather groups are included in the TAF. However, drifting dust (DRDU), drifting sand (DRSA), drifting snow (DRSN), shallow fog (MIFG), partial fog (PRFG), and patchy fog (BCFG) may be forecast with prevailing visibility greater than or equal to 7 sm.
When a whole number and a fraction are used to forecast visibility, a space is included between them (e.g., 1 1/2SM). Visibility greater than 6 sm is encoded as P6SM.
If the visibility is not expected to be the same in different directions, prevailing visibility is used.
When volcanic ash (VA) is forecast in the significant weather group, visibility is included in the forecast, even if it is unrestricted (P6SM). For example, an expected reduction of visibility to 10 sm by volcanic ash is encoded in the forecast as P6SM VA.
Although not used by the NWS in U.S. domestic TAFs, the contraction CAVOK (ceiling and visibility OK) may replace the visibility, weather, and sky condition groups if all of the following conditions are forecast: visibility of 10 km (6 sm) or more, no clouds below 1500 m (5,000 ft) or below the highest minimum sector altitude (whichever is greater), no cumulonimbus, and no significant weather phenomena.
Examples:
P6SM
Visibility unrestricted.
1 1/2SM
Visibility 1 and ½ sm.
4SM
Visibility 4 sm.
Significant Weather Group (w’w’ or NSW)
The significant weather group (w’w’ or NSW) consists of the appropriate qualifier(s) and weather phenomenon contraction(s) or NSW (no significant weather).
If the initial forecast period and subsequent FM groups are not forecast to have explicit significant weather, the significant weather group is omitted. NSW is not used in the initial forecast time period or FM groups.
One or more significant weather group(s) is (are) included when the visibility is forecast to be 6 sm or less. The exceptions are: volcanic ash (VA), low drifting dust (DRDU), low drifting sand (DRSA), low drifting snow (DRSN), shallow fog (MIFG), partial fog (PRFG), and patchy fog (BCFG). Obstructions to vision are only forecast when the prevailing visibility is less than 7 sm or, in the opinion of the forecaster, is considered operationally significant.
Volcanic ash (VA) is always forecast when expected. When VA is included in the significant weather group, visibility is included in the forecast as well, even if the visibility is unrestricted (P6SM).
NSW is used in place of significant weather only in a temporary (TEMPO) group to indicate when significant weather (including in the vicinity (VC)) included in a previous subdivided group is expected to end.
Multiple precipitation elements are encoded in a single group (e.g., –TSRASN). If more than one type of precipitation is forecast, up to three appropriate precipitation contractions can be combined in a single group (with no spaces) with the predominant type of precipitation being first. In this single group, the intensity refers to the total precipitation and can be used with either one or no intensity qualifier, as appropriate. In TAFs, the intensity qualifiers (light, moderate, and heavy) refer to the intensity of the precipitation and not to the intensity of any thunderstorms associated with the precipitation.
Intensity is coded with precipitation types (except ice crystals and hail), including those associated with thunderstorms and those of a showery nature (SH). No intensity is ascribed to blowing dust (BLDU), blowing sand (BLSA), or blowing snow (BLSN). Only moderate or heavy intensity is ascribed to a sandstorm (SS) and dust storm (DS).
Exception for Encoding Multiple Precipitation Types
When more than one type of precipitation is forecast in a time period, any precipitation type associated with a descriptor (e.g., FZRA) is encoded first in the precipitation group, regardless of the predominance or intensity of the other precipitation types. Descriptors are not encoded with the second or third precipitation type in the group. The intensity is associated with the first precipitation type of a multiple precipitation type group. For example, a forecast of moderate snow and light freezing rain is coded as -FZRASN, although the intensity of the snow is greater than the freezing rain.
Examples:
Combinations of one precipitation and one nonprecipitation weather phenomenon:
- -DZ FG
Light drizzle and fog (obstruction that reduces visibility to less than 5/8 sm).
- RA BR
Moderate rain and mist.
- -SHRA FG
Light rain showers and fog.
- +SN FG
Heavy snow and fog.
Combinations of more than one type of precipitation:
- -RASN FG HZ
Light rain and snow (light rain predominant), fog, and haze.
- TSSNRA
Thunderstorm with moderate snow and rain (moderate snow predominant).
- FZRASNPL
Moderate freezing rain, snow, and ice pellets (freezing rain mentioned first due to the descriptor, followed by other precipitation types in order of predominance).
- SHSNPL
Moderate snow showers and ice pellets.
Thunderstorm Descriptor
The TS descriptor is treated differently than other descriptors in the following cases:
- When nonprecipitating thunderstorms are forecast, TS may be encoded as the sole significant weather phenomenon; and
- When forecasting thunderstorms with freezing precipitation (FZRA or FZDZ), the TS descriptor is included first, followed by the intensity and weather phenomena.
Example:
TS -FZRA
When a thunderstorm is included in the significant weather group (even using vicinity, VCTS), the cloud group (NsNsNshshshs) includes a forecast cloud type of CB. See the following example for encoding VCTS.
Example:
-FZRA VCTS BKN010CB
Fog Forecast
A visibility threshold must be met before a forecast for fog (FG) is included in the TAF. When forecasting a fog-restricted visibility from 5/8 to 6 sm, the phenomenon is coded as BR (mist). When a fog-restricted visibility is forecast to result in a visibility of less than 5/8 sm, the code FG is used. The forecaster never encodes weather obstruction as mist (BR) when the forecast visibility is greater than 6 sm (P6SM).
Fog-related terms are used as described in Table 27-4.
Table 27-4. TAF Fog Terms
| Term | Description |
| Any fog (visibility less than 5/8 sm) consisting predominantly of water droplets at temperatures less than or equal to 32 ˚F (0 ˚C), whether or not rime ice is expected to be deposited. FZBR is not a valid significant weather combination and will not be used in TAFs. | |
| Freezing Fog (FZFG) | |
| Shallow Fog (MIFG) | The visibility at 6 ft AGL is greater than or equal to 5/8 sm and the apparent visibility in the fog layer is less than 5/8 sm. |
| Patchy Fog (BCFG) | Fog patches covering part of the airport. The apparent visibility in the fog patch or bank is less than 5/8 sm, with the foggy patches extending to at least 6 ft AGL. |
| Partial Fog (PRFG) | A substantial part of the airport is expected to be covered by fog while the remainder is expected to be clear of fog (e.g., a fog bank). Note: MIFG, PRFG, and BCFG may be forecast with prevailing visibility of P6SM. |
Examples:
1/2SM FG
Fog is reducing visibilities to less than 5/8 sm, therefore FG is used to encode the fog.
3SM BR
Fog is reducing visibilities to between 5/8 and 6 sm, therefore BR is used to encode the fog.
Vicinity (VC)
In the United States, vicinity (VC) is defined as a donut-shaped area between 5 and 10 sm from the center of the airport’s runway complex. NWS TAFs may include a prevailing condition forecast of fog, showers, and thunderstorms in the airport’s vicinity. A prevailing condition is defined as a greater than or equal to 50 percent probability of occurrence for more than half of the subdivided forecast time period. VC is not included in temporary (TEMPO) or probability (PROB) groups.
The significant weather phenomena in Table 27-5 are valid for use in prevailing portions of NWS’ TAFs in combination with VC.
Table 27-5. TAF Use of Vicinity (VC)
| Phenomenon | Coded |
| Fog* | VCFG |
| Shower(s)** | VCSH |
| Thunderstorm | VCTS |
*Always coded as VCFG regardless of visibility in the obstruction, and without qualification as to intensity or type (frozen or liquid). **The VC group, if used, should be the last entry in any significant weather group.
Cloud and Vertical Obscuration Groups (NsNsNshshshs or VVhshshs or SKC)
The initial time period and any subsequent FM groups include a cloud or obscuration group (NsNsNshshshs or VVhshshs or SKC), used as appropriate to indicate the cumulative amount (NsNsNs) of all cloud layers in ascending order and height (hshshs), to indicate vertical visibility (VVhshshs) into a surface-based obstructing medium, or to indicate a clear sky (SKC). All cloud layers and obscurations are considered opaque.
Cloud Group (NsNsNshshshs)
The cloud group (NsNsNshshshs) is used to forecast cloud amount as indicated in Table 27-6.
Table 27-6. TAF Sky Cover
| Sky Cover Contraction | Sky Coverage |
| SKC | 0 oktas |
| FEW | 0 to 2 oktas |
| SCT | 3 to 4 oktas |
| BKN | 5 to 7 oktas |
| OVC | 8 oktas |
When 0 oktas of sky coverage is forecast, the cloud group is replaced by SKC. The contraction CLR, which is used in the METAR code, is not used in TAFs. TAFs for sites with an ASOS or AWOS contain the cloud amount and/or obscurations, which the forecaster expects, not what is expected to be reported by an
ASOS/AWOS.
Heights of clouds (hshshs) are forecast in hundreds of feet AGL.
The lowest level at which the cumulative cloud cover equals 5/8 or more of the celestial dome is understood to be the forecast ceiling. For example, VV008, BKN008, or OVC008 all indicate an 800-ft ceiling.
Vertical Obscuration Group (VVhshshs)
The vertical obscuration group (VVhshshs) is used to forecast, in hundreds of feet AGL, the vertical visibility (VV) into a surface-based total obscuration. VVhshshs is this ceiling at the height indicated in the forecast. TAFs do not include forecasts of partial obscurations (i.e., FEW000, SCT000, or BKN000).
Example:
1SM BR VV008
Ceiling is 800 ft due to vertical visibility into fog.
Cloud Type (CB)
The only cloud type included in the TAF is CB. CB follows cloud or obscuration height (hshshs) without a space whenever thunderstorms are included in the significant weather group (w’w’), even if thunderstorms are only forecast in the vicinity (VCTS). CB can be included in the cloud group (NsNsNshshshs) or the vertical obscuration group (VVhshshs) without mentioning a thunderstorm in the significant weather group (w’w’). Therefore, situations may occur where nearly identical NsNsNshshshs or VVhshshs appear in consecutive time periods, with the only change being the addition or elimination of CB in the forecast cloud type.
Examples:
1/2SM TSRA OVC010CB
Thunderstorms are forecast at the airport.
Nonconvective Low-Level Wind Shear (LLWS) Group (WShwshwshws/dddffKT)
Wind shear (WS) is defined as a rapid change in horizontal wind speed and/or direction, with distance and/or a change in vertical wind speed and/or direction with height. A sufficient difference in wind speed, wind direction, or both can severely impact airplanes, especially within 2,000 ft AGL because of limited vertical airspace for recovery.
Forecasts of LLWS in the TAF refer only to nonconvective LLWS from the surface up to and including 2,000 ft AGL. LLWS is always assumed to be present in convective activity. LLWS is included in TAFs on an “as-needed” basis to focus the aircrew’s attention on LLWS problems that currently exist or are expected. Nonconvective LLWS may be associated with the following: frontal passage, inversion, low-level jet, lee-side mountain effect, sea breeze front, Santa Ana winds, etc.
When LLWS conditions are expected, the nonconvective LLWS code WS is included in the TAF as the last group (after cloud forecast). Once in the TAF, the WS group remains the prevailing condition until the next FM change group or the end of the TAF valid period if there are no subsequent FM groups. Forecasts of nonconvective LLWS are not included in TEMPO or PROB groups.
The format of the nonconvective LLWS group is:
WShwshwshws/dddffKT
WS Indicator for nonconvective LLWS.
Hwshwshws Height of the top of the wind shear layer in hundreds of feet AGL.
Ddd True direction in 10° increments at the indicated height.
(VRB is not used for direction in the nonconvective LLWS forecast.)
| Ff | Speed in knots of the forecast wind at the indicated height. |
| KT | Unit indicator for wind. |
Example:
TAF…13012KT…WS020/27055KT
Wind shear from the surface to 2,000 ft. Surface winds from 130° (southeast) at 12 kt changes to 270° (west) at 55 kt at 2,000 ft.
In this example, the indicator WS is followed by a three-digit number that is the top of the wind shear layer. LLWS is forecast to be present from the surface to this level. After the solidus (/), the five-digit wind group is the wind direction and speed at the top of the wind shear layer. It is not a value for the amount of shear.
A nonconvective LLWS forecast is included in the initial time period or an FM group in a TAF whenever:
- One or more PIREPs are received of nonconvective LLWS within 2,000 ft of the surface, at or in the vicinity of the TAF airport, causing an indicated air speed loss or gain of 20 kt or more, and the forecaster determines the report(s) reflect a valid nonconvective LLWS event rather than mechanical turbulence; or
- Nonconvective vertical wind shear of 10 kt or more per 100 ft in a layer more than 200 ft thick is expected or reliably reported within 2,000 ft of the surface at, or in the vicinity of, the airport.
Forecast Change Indicator Groups
Forecast change indicator groups are contractions that are used to subdivide the forecast period (24 hours for scheduled TAFs; less for amended or delayed forecasts) according to significant changes in the weather.
The forecast change indicators FM, TEMPO, and PROB are used when a change in any or all of the forecast elements is expected.
From (FM) Group (FMYYGGgg)
The change group FMYYGGgg (voiced as “from”) is used to indicate when prevailing conditions are expected to change significantly over a period of less than 1 hour. In these instances, the forecast is subdivided into time periods using the contraction FM, followed, without a space, by six digits, the first two of which indicate the day of the month and the final four indicate the time (in hours and minutes Z) the change is expected to occur. While the use of a four-digit time in whole hours (e.g., 2100Z) is acceptable, if a forecaster can predict changes and/or events with higher resolution, then more precise timing of the change to the minute will be indicated. All forecast elements following FMYYGGgg relate to the period of time from the indicated date and time (YYGGgg) to the end of the valid period of the terminal forecast, or to the next FM if the terminal forecast valid period is divided into additional periods.
The FM group will be followed by a complete description of the weather (i.e., self-contained), and all forecast conditions given before the FM group are superseded by those following the group. All elements of the TAF (e.g., surface wind, visibility, significant weather, clouds, obscurations, and when expected, nonconvective LLWS) will be included in each FM group, regardless if they are forecast to change or not. For example, if forecast cloud and visibility changes warrant a new FM group but the wind does not, the new FM group will include a wind forecast, even if it is the same as the most recently forecast wind.
The only exception to this involves the significant weather group. If no significant weather is expected in the FM time period group, then significant weather group is omitted. A TAF may include one or more FM groups, depending on the prevailing weather conditions expected. In the interest of clarity, each FM group starts on a new line of forecast text, indented five spaces.
Examples:
TAF
KDSM 022336Z 0300/0324 20015KT P6SM BKN015
FM030230 29020G35KT 1SM +SHRA OVC005 TEMPO 0303/0304 30030G45KT 3/4SM -SHSN FM030500 31010G20KT P6SM SCT025…
A change in the prevailing weather is expected on the 3rd day of the month at 0230 UTC and the 3rd day of the month at 0500 UTC.
TAF
KAPN 312330Z 0100/0124 13008KT P6SM SCT030
FM010320 31010KT 3SM -SHSN BKN015 FM010500 31010KT 1/4SM +SHSN VV007…
Note that the wind in the FM010500 group is the same as the previous FM group, but is repeated since all elements are to be included in a FM group.
Temporary (TEMPO) Group (TEMPO YYGG/YeYeGeGe)
The change-indicator group TEMPO YYGG/YeYeGeGe is used to indicate temporary fluctuations to forecast meteorological conditions that are expected to:
- Have a high percentage (greater than 50 percent) probability of occurrence;
- Last for one hour or less in each instance; and
- In the aggregate, cover less than half of the period YYGG to YeYeGeGe.
The first two digits (YY) are the day of the month for the start of the TEMPO. The next two digits (GG) are the starting hour (UTC). After the solidus (/), the next two digits (YeYe) are the ending day of the month, while the last two digits (GeGe) are the ending hour (UTC) of the TEMPO period.
Each TEMPO group is placed on a new line in the TAF. The TEMPO identifier is followed by a description of all the elements in which a temporary change is forecast. A previously forecast element that has not changed during the TEMPO period is understood to remain the same and will not be included in the TEMPO group. Only those weather elements forecast to temporarily change are included in the TEMPO group.
TEMPO groups will not include forecasts of either significant weather in the vicinity (VC) or nonconvective LLWS.
Examples:
TAF
KDDC 221130Z 2212/2312 29010G25KT P6SM SCT025 TEMPO 2215/2217 30025G35KT 1 1/2SM SHRA BKN010…
In the example, all forecast elements in the TEMPO group are expected to be different than the prevailing conditions. The TEMPO group is valid on the 17th day of the month from 1500 UTC to 1700 UTC.
TAF
KSEA 091125Z 0912/1012 19008KT P6SM SCT010 BKN020 OVC090 TEMPO 0912/0915 -RA SCT010 BKN015 OVC040…
In this example the visibility is not forecast in the TEMPO group. Therefore, the visibility is expected to remain the same (P6SM) as forecast in the prevailing conditions group. Also, note that in the TEMPO 0912/0915 group, all three cloud layers are included, although the lowest layer is not forecast to change from the initial time period.
Probability (PROB) Group (PROB30 YYGG/YeYeGeGe)
The probability group (PROB30 YYGG/YeYeGeGe) is only used by NWS forecasters to forecast a low-probability occurrence (30 percent chance) of a thunderstorm or precipitation event and its associated weather and obscuration elements (e.g., wind, visibility, and/or sky condition) at an airport.
The PROB30 group is the forecaster’s assessment of probability of occurrence of the weather event that follows it. The first two digits (YY) are the day of the month for the start of the PROB30. The next two digits (GG) are the starting hour (UTC). After the solidus (/), the next two digits (YeYe) are the ending day of the month, while the last two digits (GeGe) are the ending hour (UTC) of the PROB30 period. PROB30 is the only PROB group used in NWS’ TAFs.
Note: The U.S. military and international TAFs may use the PROB40 (40 percent chance) group as well.
The PROB30 group is located within the same line of the prevailing condition group, continuing on the line below if necessary.
The NWS’ TAFs do not use the PROB30 group in the first 9 hours of the TAF’s valid period, including amendments. Also, only one PROB30 group may be used in the initial forecast period and in any subsequent FM groups. Note that the U.S. military and international TAFs do not have these restrictions.
PROB30 groups do not include forecasts of significant weather in the vicinity (VC) or nonconvective LLWS.
Example:
FM012100 18015KT P6SM SCT050 PROB30 0123/0201 2SM TSRA OVC020CB
In this example, the PROB30 group is valid on the 1st day of the month at 2300 UTC to the 2nd day of the month at 0100 UTC.
TAFs for Joint-Use (Joint Civilian/Military) Airports
The TAF format at some joint-use airports is different from the NWS TAF format as follows:
- Visibility is in meters instead of statute miles. o Example: BECMG 0504/0505 21006KT 9000 BR SKC QNH3005INS.
- Includes a forecast of the lowest barometric altimeter setting (QNH) during the forecast period in inches of mercury. o Example: BECMG 0504/0505 21006KT 9000 BR SKC QNH3005INS.
- Includes a forecast of the maximum temperature (in whole degrees Celsius) and expected time of occurrence.
- Example: BECMG 0511/0512 16005KT 9999 NSW SKC QNH3006INS TX28/0420Z TN22/0410Z.
- Includes a forecast of the minimum temperature (in whole degrees Celsius) and expected time of occurrence.
- Example: TN22/0410Z BECMG 0511/0512 16005KT 9999 NSW SKC QNH3006INS TX28/0420Z TN22/0410Z.
TAF Examples
TAF
KPIR 111140Z 1112/1212 13012KT P6SM BKN100 WS020/35035KT
TEMPO 1112/1114 5SM BR
FM111500 16015G25KT P6SM SCT040 BKN250
FM120000 14012KT P6SM BKN080 OVC150 PROB30 1200/1204 3SM TSRA BKN030CB
FM120400 14008KT P6SM SCT040 OVC080 TEMPO 1204/1208 3SM TSRA OVC030CB
| TAF | Terminal Aerodrome Forecast. | |
| KPIR | Pierre, South Dakota. | |
| 111140 | Prepared on the 11th day of the month at 1140 UTC. | |
| 1112/1212 | Valid from the 11th day of the month at 1200 UTC until the 12th day of the month at 1200 UTC. | |
| 13012KT | Wind 130° true at 12 kt. | |
| P6SM | Visibility greater than 6 sm. | |
| BKN100 | Ceiling 10,000 ft broken. | |
| WS020/35035KT | Wind shear at 2,000 ft, wind from 350° true at 35 kt. | |
| TEMPO 1112/1114 | Temporary conditions between the 11th day of the month at 1200 UTC and the 11th day of the month at 1400 UTC. | |
| 5SM | Visibility 5 sm. | |
| BR | Mist. | |
| FM111500 | From the 11th day of the month at 1500 UTC. | |
| 16015G25KT | Wind 160° true at 15 kt gusting to 25 kt. | |
| P6SM | Visibility greater than 6 sm. | |
| SCT040 BKN250 | 4,000 ft scattered, ceiling 25,000 ft broken. | |
| FM120000 | From the 12th day of the month at 0000Z. | |
| 14012KT | Wind 140° true at 12 kt. | |
| P6SM | Visibility greater than 6 sm. | |
| BKN080 OVC150 | Ceiling 8,000 ft broken, 15,000 ft overcast. | |
| PROB30 1200/1204 | 30 percent probability between the 12th day of the month at 0000 UTC and the 12th day of the month at 0400 UTC. | |
| 3SM | Visibility 3 sm. | |
| TSRA | Thunderstorm with moderate rain showers. | |
| BKN030CB | Ceiling 3,000 ft broken with cumulonimbus. | |
| FM120400 | From the 12th day of the month at 0400 UTC. | |
| 14008KT | Wind 140° true at 8 kt. | |
| P6SM | Visibility greater than 6 sm. | |
| SCT040 OVC080 | 4,000 ft scattered, ceiling 8,000 ft overcast. | |
| TEMPO 1204/1208 | Temporary conditions between the 12th day of the month at 0400 UTC and the 12th day of the month at 0800 UTC. | |
| 3SM | Visibility 3 sm. | |
| TSRA | Thunderstorms with moderate rain showers. | |
| OVC030CB | Ceiling 3,000 ft overcast with cumulonimbus. | |
TAF AMD
KEYW 131555Z 1316/1412 VRB03KT P6SM VCTS SCT025CB BKN250
TEMPO 1316/1318 2SM TSRA BKN020CB
FM131800 VRB03KT P6SM SCT025 BKN250 TEMPO 1320/1324 1SM TSRA OVC010CB
FM140000 VRB03KT P6SM VCTS SCT020CB BKN120 TEMPO 1408/1412 BKN020CB
| TAF AMD | Amended Terminal Aerodrome Forecast. |
| KEYW | Key West, Florida. |
| 131555Z | Prepared on the 13th day of the month at 1555 UTC. |
| 1316/1412 | Valid from the 13th day of the month at 1600 UTC until the 14th day of the month at 1200 UTC |
| VRB03KT | Wind variable at 3 kt. |
| P6SM | Visibility greater than 6 sm. |
| VCTS | Thunderstorms in the vicinity. |
| SCT025CB BKN250 | 2,500 ft scattered with cumulonimbus, ceiling 25,000 ft broken. |
| TEMPO 1316/1318 | Temporary conditions between the 13th day of the month at 1600 UTC and the 13th day of the month at 1800 UTC. |
| 2SM | Visibility 2 sm. |
| TSRA | Thunderstorms with moderate rain showers. |
| BKN020CB | Ceiling 2,000 ft broken with cumulonimbus. |
| FM131800 | From the 13th day of the month at 1800 UTC. |
| VRB03KT | Wind variable at 3 kt. |
| P6SM | Visibility greater than 6 sm. |
| SCT025 BKN250 | 2,500 ft scattered, ceiling 25,000 ft broken. |
| TEMPO 1320/1324 | Temporary conditions between the 13th day of the month at 2000 UTC and the 14th day of the month at 0000 UTC. |
| 1SM | Visibility 1 sm. |
| TSRA | Thunderstorms with moderate rain showers. |
| OVC010CB | Ceiling 1,000 ft overcast with cumulonimbus. |
| FM140000 | From the 14th day of the month at 0000 UTC. |
| VRB03KT | Variable wind at 3 kt. |
| P6SM | Visibility greater than 6 sm. |
| VCTS | Thunderstorms in the vicinity. |
| SCT020CB BKN120 | 2,000 ft scattered with cumulonimbus, ceiling 12,000 ft broken. |
| TEMPO 1408/1412 | Temporary conditions between the 14th day of the month at 0800 UTC and the 14th day of the month at 1200 UTC. |
| BKN020CB | Ceiling 2,000 ft broken with cumulonimbus. |
Issuance
Scheduled TAFs prepared by NWS offices are issued at least four times a day, every 6 hours. Some locations have amendments routinely issued 3 hours after the initial issuance. The issuance schedule is shown in Table 27-7.
The issuance of a new TAF cancels any previous TAF for the same location.
Table 27-7. TAF Issuance Schedule
| Scheduled Issuance | Valid Period | End Time for 30 Hour | Issuance Window |
| 0000 UTC | 0000 to 0000 | 0600 UTC | 2320 to 2340 UTC |
| 0300 UTC (AMD) | 0300 to 0000 UTC | 0600 UTC | |
| 0600 UTC | 0600 to 0600 | 1200 UTC | 0520 to 0540 UTC |
| 0900 UTC (AMD) | 0900 to 0600 UTC | 1200 UTC | |
| 1200 UTC | 1200 to 1200 | 1800 UTC | 1120 to 1140 UTC |
| 1500 UTC (AMD) | 1500 to 1200 UTC | 1800 UTC | |
| 1800 UTC | 1800 to 1800 | 0000 UTC | 1720 to 1740 UTC |
| 2100 UTC (AMD) | 2100 to 1800 UTC | 0000 UTC | |
Minimum Observational Criteria for Routine TAF Issuance and Continuation
The NWS forecaster must have certain information for the preparation and scheduled issuance of each individual TAF. Although integral to the TAF writing process, a complete surface (METAR/SPECI) observation is not needed. Forecasters use the “total observation concept” to write TAFs with data including nearby surface observations, radar, satellite, radiosonde, model data, aircraft, and other sources.
If information sources, such as surface observations, are missing, unreliable, or not complete, forecasters will append AMD NOT SKED to the end of a TAF. The use of AMD NOT SKED indicates the forecaster has enough data, using the total observation concept, to issue a forecast, but will not provide updates. This allows airport operations to continue using a valid TAF.
In rare situations where observations have been missing for extended periods of time (i.e., more than one TAF cycle of 6 hours) and the total observation concept cannot provide sufficient information, the TAF may be suspended by the use of NIL TAF.
Sites with Scheduled Part-Time Observations
For TAFs with less than 24-hour observational coverage, the TAF will be valid to the end of the routine scheduled forecast period even if observations cease prior to that time. The time observations are scheduled to end and/or resume will be indicated by expanding the AMD NOT SKED statement. Expanded statements will include the observation ending time (AFT Y1Y1HHmm, e.g., AFT 120200), the scheduled observation resumption time (TIL Y1Y1HHmm, e.g., TIL 171200Z) or the period of observation unavailability (Y1Y1HH/YeYehh, e.g., 2502-2512). TIL will be used only when the beginning of the scheduled TAF valid period coincides with the time of the last observation or when observations are scheduled to resume prior to the next scheduled issuance time. When used, these remarks will immediately follow the last forecast group. If a routine TAF issuance is scheduled to be made after observations have ceased, but before they resume, the remark AMD NOT SKED will immediately follow the valid period group of the scheduled issuance. After sufficient data using the total observation concept has been received, the AMD NOT SKED remark will be removed.
Examples of Scheduled Part-Time Observations TAFs:
TAF AMD
KRWF 150202Z 1502/1524 {TAF text}
AMD NOT SKED 1505Z-1518Z=
No amendments will be available between the 15th day of the month at 0500 UTC and the 15th day of the month at 1800 UTC due to lack of a complete observational set between those times.
TAF AMD
KPSP 190230Z 1903/1924 {TAF text} AMD NOT SKED=
Amendments are not scheduled.
Automated Observing Sites Requiring Part-Time Augmentation
TAFs for automated stations without present weather and obstruction to vision information and have no augmentation or only part-time augmentation are prepared using the procedures for part-time manual observation sites detailed in the previous section, with one exception. This exception is the remark used when the automated system is unattended. Specifically, the time an augmented automated system is scheduled to go into unattended operation and/or the time augmentation resumes is included in a remark unique to automated observing sites: AMD LTD TO CLD VIS AND WIND (AFT YYHHmm, or TIL YYhhmm, or YYHH-YYhh), where YY is the date, HHmm is the time, in hours and minutes, of last augmented observation, and hhmm is the time, in hours and minutes, the second complete observation is expected to be received. This remark, which does not preclude amendments for other forecast elements, is appended to the last scheduled TAF issued prior to the last augmented observation. It will also be appended to all subsequent amendments until augmentation resumes.
The AMD LTD TO (elements specified) remark is a flag for users and differs from the AMD NOT SKED AFT Z remark for part-time manual observation sites. AMD LTD TO means users should expect amendments only for those elements and the times specified.
Example:
TAF AMD
KCOE 150202Z 1502/1524 text
AMD LTD TO CLD VIS AND WIND 1505-1518=
The amended forecast indicates that amendments will only be issued for wind, visibility, and clouds, between the 15th day of the month at 0500Z and the 15th day of the month at 1800Z.
An amendment includes forecasts for all appropriate TAF elements, even those not reported when the automated site is not augmented. If unreported elements are judged to be crucial to the TAF and cannot be adequately determined (e.g., fog versus moderate snow), the TAF will be suspended (i.e., an amended TAF stating “AMD NOT SKED”).
AWOS systems with part-time augmentation, which the forecaster suspects are providing unreliable information when not augmented, will be reported for maintenance and treated the same as part-time manual observation sites. In such cases, the AMD NOT SKED AFT YY/aaZ remark will be used.
Non-Augmented Automated Observing Sites
The TAF issued for automated observing stations with no augmentation may be suspended in the event the forecaster is notified of, or strongly suspects, an outage or unrepresentative data. Forecasters may also suspend TAF amendments when an element the forecaster judges to be critical is missing from the observation and cannot be obtained using the total observation concept. The term AMD NOT SKED will be appended, on a separate line and indented five spaces, to the end of an amendment to the existing TAF when appropriate.
Aviation Surface Forecast and Aviation Clouds Forecast
The Aviation Surface Forecast and Aviation Clouds Forecast graphics are snapshot images derived from a subset of the aviation weather forecasts within the GFA Tool (see Chapter 28, Aviation Weather Tools). A CONUS view is available as well as several regional views. Forecasts are provided for 3, 6, 9, 12, 15, and 18 hours.
The Aviation Surface Forecast (see Figure 27-3) provides obscurations, visibility, weather phenomena, and winds (including wind gusts) with AIRMET Sierra for IFR conditions and AIRMET Tango for sustained surface winds of 30 kt or more overlaid. The Aviation Clouds Forecast (see Figure 27-4) provides cloud coverage, bases, layers, and tops with AIRMET Sierra for mountain obscuration and AIRMET Zulu for icing overlaid.
The Aviation Clouds Forecast graphic provides a forecast of cloud coverage and height (in hundreds of feet MSL). Tops of the highest broken (BKN) or overcast (OVC) layer are shown when bases are below FL180. Overlays of AIRMETs for icing and mountain obscuration are included when applicable.
Both of these products are updated every 3 hours and provide forecast snapshots for 3, 6, 9, 12, 15, and 18 hours in the future.
These forecasts are presented on regional maps as well as a CONUS map. The regional maps provide more detail than the CONUS map. The NWS plans to expand the coverage beyond the CONUS.
Complete product information can be found on the AWC’s website.
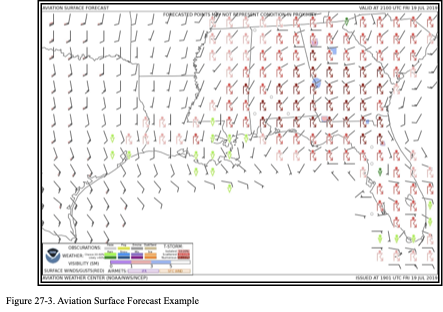
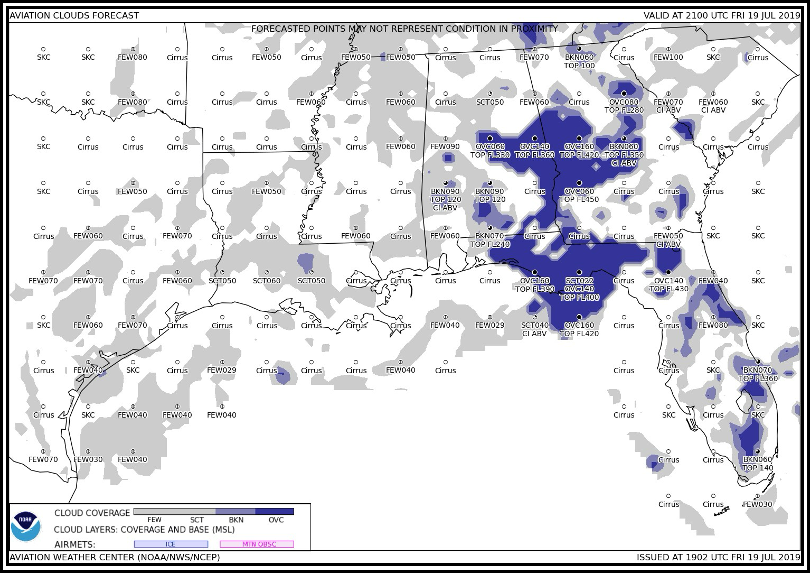
Figure Aviation Clouds Forecast Example
Area Forecasts (FA)
An FA is an abbreviated plain language (text) forecast concerning the occurrence or expected occurrence of specified en route weather phenomena. FAs cover an 18 to 24-hour period, depending on the region, are issued three to four times daily, depending on the region, and are updated as needed. The exact phenomenon contained in FAs also varies by region. Text FAs are produced by the NWS for Alaska, Hawaii, the Gulf of Mexico, and the Caribbean. Text FAs for the CONUS were retired in late 2017 and replaced by the NWS’ GFA Tool (see Chapter 28) and the aforementioned Aviation Surface Forecast and Aviation Clouds Forecast graphics The NWS plans to replace the Alaska, Hawaii, Gulf of Mexico, and Caribbean FAs with GFAs in the coming years. Text FAs for Hawaii, the Gulf of Mexico, and the Caribbean are expected to be retired in 2024. These text products will be replaced by the GFA Tool.
FA Standardization
All FAs follow these standards:
- All heights or altitudes are referenced to MSL, unless otherwise noted (i.e., prefaced by AGL or CIG), and annotated using the height in hundreds of feet, consisting of three digits (e.g., 040). For heights at or above 18,000 ft, the level is preceded by “FL” to represent flight levels (e.g., FL180). Tops are always referenced to MSL.
- References to latitude and longitude are in whole degrees and minutes following the model: Nnn[nn] or Snn[nn], Wnnn[nn], or Ennn[nn] with a space between latitude and longitude and a hyphen between successive points (e.g., N3106 W07118 – N3011 W7209).
- Messages are prepared in abbreviated plain language using contractions from FAA Order 7340.2, Contractions, for domestic products, and from ICAO Doc 8400, ICAO Abbreviations and Codes, for products issued for Oceanic FIRs. A limited number of nonabbreviated words, geographical names, and numerical values of a self-explanatory nature may also be used.
- Weather and obstructions to visibility are described using the weather abbreviations for surface weather observations (METAR/SPECI) (see Section 24.3).
FA Issuance Schedule
FAs are scheduled products issued at the times listed in Table 27-8 below.
Table 27-8. FA Issuance Schedule
| Gulf of Mexico (UTC) | Caribbean (UTC) | Hawaii (UTC) | Alaska (UTC) | |
| 0330 | 0340 | 0415 (DT)/0515 (ST) | ||
| 1st Issuance | 0130 | |||
| 2nd Issuance | 1030 | 0930 | 0940 | 1215 (DT)/1315 (ST) |
| 3rd Issuance | 1830 | 1530 | 1540 | 2015 (DT)/2115 (ST) |
| 4th Issuance | None | 2130 | 2140 | None |
Note: DT—During Alaska Daylight Time; ST—During Alaska Standard Time; UTC—Coordinated Universal Time.
FA Amendments and Corrections
Amendments are issued whenever the weather significantly improves or deteriorates based upon the judgment of the forecaster. AMD is included after the date/time group. The date/time group on the WMO and FAA lines is updated to indicate the time of the correction. The ending valid time remains unchanged.
FAs containing errors will be corrected. COR is included after the date/time group.
FA Issuance
See the following sections for the NWS offices that issue FAs and for which areas.
Alaska
FA Issuance
Issued by the AAWU. There are seven FAs containing a total of 25 zones (see Table 27-9), covering separate geographical areas of Alaska and the adjacent coastal waters, including the Pribilof Islands and Southeast Bering Sea (see Figure 27-5).
FAs issued for Alaska cover the airspace between the surface and 45,000 ft MSL and include the following elements:
- Synopsis: A brief description of the significant synoptic weather affecting the FA area during the first 18 hours of the forecast period.
- Significant Clouds and Weather: A description of the significant clouds and weather for each geographical zone during the first 12 hours of the forecast period, including the following elements:AIRMET information for IFR ceiling and visibility, mountain obscuration, and strong surface winds.
- Cloud amount (SCT, BKN, or OVC) with bases and tops.
- Visibility below 7 sm and obstruction(s) to visibility.
- Precipitation and thunderstorms.
- Surface wind greater than 20 kt.
- Mountain pass conditions using categorical terms (for selected zones only).
- Categorical outlook (VFR, MVFR, and IFR) for 12 to 18 hours.
- Icing and Freezing Level: A description of expected icing conditions, including the following elements:
- AIRMET information for icing and freezing precipitation.
- Icing not meeting SIGMET or AIRMET criteria during the 6- to 12-hour period.
- Freezing level.
- If no significant icing is forecast, NIL SIG will be entered, followed by the freezing level.
- Turbulence: A description of expected turbulence conditions, including the following elements
- AIRMET information for turbulence or LLWS.
- Turbulence not meeting SIGMET or AIRMET criteria during the 6- to 12-hour period.
- If no significant turbulence is forecast, NIL SIG will be entered.
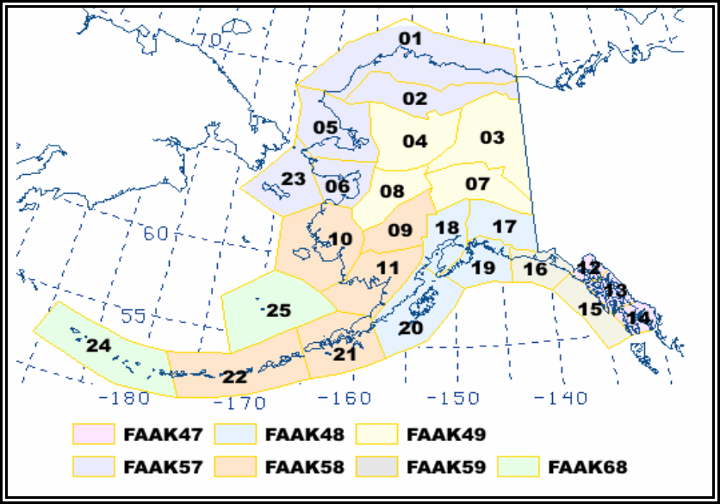
Figure AAWU Flight Advisory and FA Zones—Alaska
Table AAWU Area Forecast (FA) Zones—Alaska
| 1 | Arctic Coast Coastal | 14 | Southern Southeast Alaska |
| 2 | North Slopes of the Brooks Range | 15 | Coastal Southeast Alaska |
| 3 | Upper Yukon Valley | 16 | Eastern Gulf Coast |
| 4 | Koyukuk and Upper Kobuk Valley | 17 | Copper River Basin |
| 5 | Northern Seward Peninsula-Lower Kobuk Valley | 18 | Cook Inlet-Susitna Valley |
| 6 | Southern Seward Peninsula-Eastern Norton Sound | 19 | Central Gulf Coast |
| 7 | Tanana Valley | 20 | Kodiak Island |
| 8 | Lower Yukon Valley | 21 | Alaska Peninsula-Port Heiden to Unimak Pass |
| 9 | Kuskokwim Valley | 22 | Unimak Pass to Adak |
| 10 | Yukon-Kuskokwim Delta | 23 | St. Lawrence Island-Bering Sea Coast |
| 11 | Bristol Bay | 24 | Adak to Attu |
| 12 | Lynn Canal and Glacier Bay | 25 | Pribilof Islands and Southeast Bering Sea |
| 13 | Central Southeast Alaska |
FA—Alaska Example
FAAK47 PAWU 222010 (ICAO product header)
FA7H (NWS AWIPS Communication header)
JNUH FA 222015 (Area Forecast region, product type, issuance date/time) EASTERN GULF COAST AND SE AK…
.
AIRMETS VALID UNTIL 230415
CB IMPLY POSSIBLE SEV OR GREATER TURB SEV ICE LLWS AND IFR CONDS. NON MSL HEIGHTS NOTED BY AGL OR CIG.
.
SYNOPSIS VALID UNTIL 231400
989 MB LOW 275 NM SE KODIAK IS WILL MOV SE WARD TO ABOUT 350 NM S PASI BY 14Z WHILE FILLING TO 998 MB. ASSOCD OCFNT ARCING E AND SE FM LOW WILL MOV ONSHR SE AK AND DSIPT BY END OF PD.
.
LYNN CANAL AND GLACIER BAY JB…VALID UNTIL 230800
…CLOUDS/WX…
FEW025 SCT050 BKN100 TOP 120.
OTLK VALID 230800-231400…VFR.
PASSES…WHITE…CHILKOOT…VFR.
…TURB…
NIL SIG.
…ICE AND FZLVL…
NIL SIG. FZLVL 020.
.
CNTRL SE AK JC…VALID UNTIL 230800
…CLOUDS/WX…
FEW025 SCT050 BKN100 TOP 120.
AFT 03Z ISOL BKN050 -SHRA.
OTLK VALID 230800-231400…VFR.
…TURB…
AFT 05Z SW PAFE ISOL MOD TURB BLW 040.
…ICE AND FZLVL…
NIL SIG. FZLVL 025.
.
SRN SE AK JD…VALID UNTIL 230800
…CLOUDS/WX…
FEW025 SCT050 BKN100 TOP 120.
AFT 00Z OCNL BKN050 -RA. ISOL BKN025 -RA.
AFT 03Z SFC WND SE 25G35KT.
OTLK VALID 230800-231400…VFR.
…TURB…
AFT 02Z CLARENCE STRAIT SW ISOL MOD TURB BLW 040.
…ICE AND FZLVL…
AFT 02Z OUTER CST PAHY S ISOL MOD ICEIC 040-100. FZLVL 025.
Hawaii
FA Issuance
Issued by the WFO Honolulu for the main Hawaiian Islands and adjacent coastal waters extending out 40 NM from the coastlines (see Figure 27-6).
FAs issued for Hawaii cover the airspace between the surface and 45,000 ft MSL and include the following elements:
- Synopsis: A brief discussion of the significant synoptic weather affecting the FA area during the 18-hour valid period.
- Significant Clouds and Weather: A description of the significant clouds and weather for the first 12 hours of the forecast period, including the following elements:
- Cloud amount (SCT, BKN, or OVC) with bases and tops.
- Visibilities of 6 sm or less with obstruction(s) to visibility.
- Precipitation and thunderstorms.
- Sustained surface winds of 20 kt or greater.
- Categorical outlook (IFR, MVFR, or VFR) for 12 to 18 hours, including expected precipitation and/or obstructions to visibility.
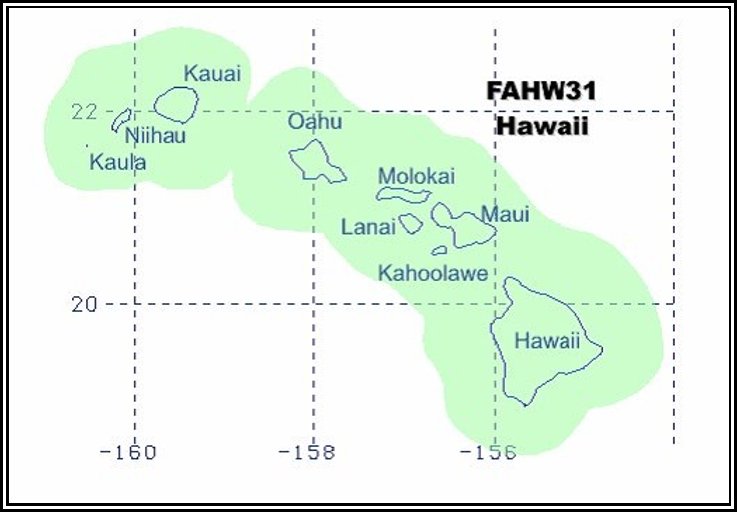
Figure WFO Honolulu FA Region and WMO Header—Hawaii
FA—Hawaii Example
FAHW31 PHFO 080940 (ICAO product header)
FA0HI (NWS AWIPS Communication header)
HNLC FA 080940 (Area Forecast region, product type, issuance date/time)
SYNOPSIS AND VFR CLD/WX
SYNOPSIS VALID UNTIL 090400
CLD/WX VALID UNTIL 082200…OUTLOOK VALID 082200-090400 .
SEE AIRMET SIERRA FOR IFR CLD AND MT OBSC.
TS IMPLY SEV OR GREATER TURB SEV ICE LOW LEVEL WS AND IFR COND. NON MSL HGT DENOTED BY AGL OR CIG.
.
SYNOPSIS…SFC HIGH FAR N PHNL NEARLY STNR.
.
BIG ISLAND ABOVE 060.
SKC. 20Z SCT090. OUTLOOK…VFR.
.
BIG ISLAND LOWER SLOPES…COAST AND ADJ WATERS FROM UPOLU POINT TO CAPE KUMUKAHI TO APUA POINT.
SCT030 BKN050 TOPS 080 ISOL BKN030 VIS 3-5SM -SHRA BR. 21Z SCT030 SCT BKN050 TOPS 080 ISOL BKN030 5SM -SHRA. OUTLOOK…VFR.
.
BIG ISLAND LOWER SLOPES…COAST AND ADJ WATERS FROM APUA POINT TO SOUTH CAPE TO UPOLU POINT. SKC. 21Z SCT-BKN060 TOPS 080. 23Z SCT030 SCT-BKN060 TOPS 080 ISOL BKN030 -SHRA. OUTLOOK…VFR.
.
BIG ISLAND LOWER SLOPES…COAST AND ADJ WATERS FROM SOUTH CAPE TO PHKO TO UPOLU POINT.
SCT050 ISOL BKN050 TOPS 080. 18Z FEW050. 23Z SCT-BKN050 TOPS 080. OUTLOOK…VFR. .
N AND E FACING SLOPES…COAST AND ADJ WATERS OF THE REMAINING ISLANDS.
SCT020 BKN045 TOPS 070 TEMPO BKN020 VIS 3-5SM -SHRA…FM OAHU EASTWARD ISOL CIG
BLW 010 AND VIS BLW 3SM SHRA BR WITH TOPS 120. 22Z SCT025 SCT-BKN050 TOPS 070 ISOL BKN025 3-5SM -SHRA. OUTLOOK…VFR.
.
REST OF AREA.
SCT035 SCT-BKN050 TOPS 070 ISOL BKN030 -SHRA. 20Z SCT050 ISOL SCT030 BKN045 TOPS 070 -SHRA. OUTLOOK…VFR
Gulf of Mexico
FA Issuance
Issued by the AWC for the northern Gulf of Mexico, including the Houston Oceanic FIR, the Gulf of Mexico portion of the Miami Oceanic FIR, and the coastal waters west of 85° W longitude
(see Figure 27-7).
FAs issued for the Gulf of Mexico (FAGX) cover the airspace between the surface and 45,000 ft MSL and include the following elements with each geographical section having an entry, even if it is negative:
- Synopsis: A brief discussion of the significant synoptic weather affecting the FAGX area during the entire 24-hour valid period.
- Significant Clouds and Weather: A description of the significant clouds and weather for the first 12 hours of the forecast period, including the following elements:
- Cloud amount (SCT, BKN, or OVC) for clouds with bases below FL180.
- Cloud bases and tops associated with the cloud amount listed above.
- Precipitation and thunderstorms.
- Visibility below 7 sm and obstruction(s) to visibility.
- Sustained surface winds greater than or equal to 20 kt.
- Categorical outlook (LIFR, IFR, MVFR, or VFR) for 12 to 24 hours.
- Icing and Freezing Level: Moderate or severe icing and freezing level.
- Turbulence: Moderate or greater turbulence.
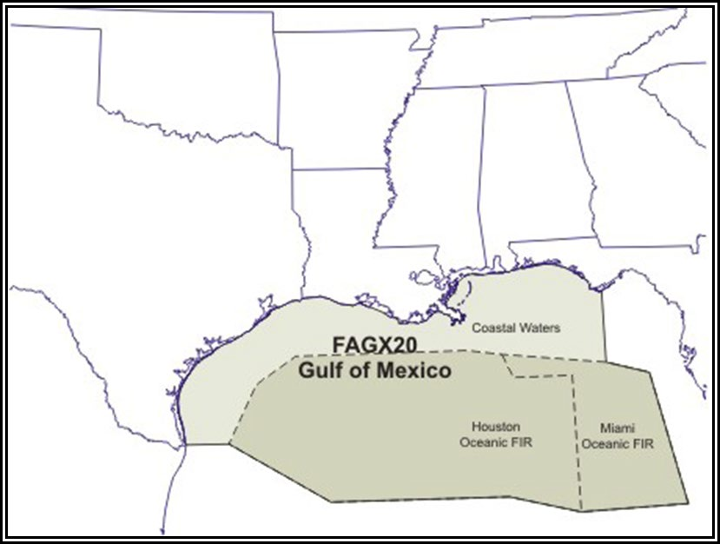
Figure AWC FA Region and WMO Header—Gulf of Mexico
FA—Gulf of Mexico (FAGX) Example
FAGX20 KKCI 091812 (ICAO product header)
OFAGX (NWS AWIPS Communication header)
SYNOPSIS VALID TIL 101900Z
FCST…091900Z-100700Z
OTLK…100700Z-101900Z
INTERNATIONAL OPERATIONS BRANCH
AVIATION WEATHER CENTER KANSAS CITY MISSOURI .
CSTL WATERS FROM COASTLINE OUT TO HOUSTON OCEANIC FIR AND GLFMEX MIAMI OCEANIC FIR AND W OF 85W. HOUSTON OCEANIC FIR AND GLFMEX MIAMI OCEANIC FIR.
.
TS IMPLY SEV OR GTR TURB SEV ICE LLWS AND IFR CONDS. HGTS MSL.
.
- SYNOPSIS…HIGH PRES OVR NRN GLFMEX.
.
- SIGNIFICANT CLD/WX…
.
CSTL WATERS…
SCT020. OTLK…VFR.
.
HOUSTON OCEANIC FIR… SCT020. OTLK…VFR.
.
GLFMEX MIAMI OCEANIC FIR…
SCT020. OTLK…VFR.
.
- ICE AND FRZLVL…
CSTL WATERS…SEE AIRMETS ZULU WAUS44 KKCI AND WAUS42 KKCI.
HOUSTON OCEANIC FIR… NO SGFNT ICE EXP OUTSIDE CNVTV ACT.
GLFMEX MIAMI OCEANIC FIR…NO SGFNT ICE EXP OUTSIDE CNVTV ACT. FRZLVL…140 THRUT.
.
- TURB…
CSTL WATERS…SEE AIRMETS TANGO WAUS44 KKCI AND WAUS42 KKCI. HOUSTON OCEANIC FIR… NO SGFNT TURB EXP OUTSIDE CNVTV ACT.
GLFMEX MIAMI OCEANIC FIR…NO SGFNT TURB EXP OUTSIDE CNVTV ACT.
Caribbean
FA Issuance
Issued by the AWC for portions of the Gulf of Mexico (south of the Houston Oceanic FIR to approximately 22º N latitude), the Caribbean Sea, and adjacent portions of the North Atlantic (see Figure 27-8).
FAs issued for the Caribbean (FACA) cover the airspace between the surface and 24,000 ft MSL and include the following elements with each geographical section having an entry, even if it is negative:
- Synopsis: A brief discussion of the significant synoptic weather affecting the FACA area during the 24-hour valid period.
- Significant Clouds and Weather: A description of the significant clouds and weather for the first 12 hours of the forecast period, including the following elements:
- Cloud amount (SCT, BKN, or OVC) for cloud bases below FL180.
- Cloud bases and tops associated with the cloud amount listed above.
- Precipitation and thunderstorms.
- Visibility below 7 sm and obstruction(s) to visibility.
- Sustained surface winds greater than or equal to 20 kt.
- Categorical outlook (IFR, MVFR, or VFR) for 12 to 24 hours.
- Icing and Freezing Level: Moderate or greater icing and freezing level.
- Turbulence: Moderate or greater turbulence.
- Significant Clouds and Weather: A description of the significant clouds and weather for the first 12 hours of the forecast period, including the following elements:
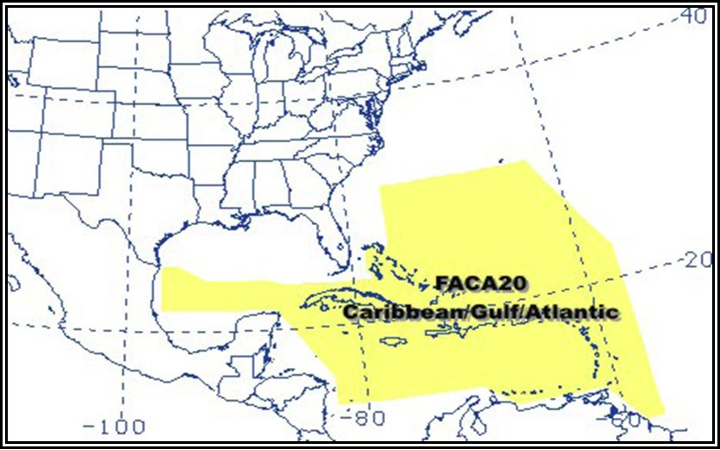
Figure AWC FA Region and WMO Header—Caribbean
FA—Caribbean (FACA) Example
FACA20 KKCI 121530 (ICAO product header)
OFAMKC (NWS AWIPS Communication header)
INTERNATIONAL OPERATIONS BRANCH
AVIATION WEATHER CENTER KANSAS CITY MISSOURI
VALID 121600-130400 OUTLOOK…130400-131600 .
ATLANTIC S OF 32N W OF 57W…CARIBBEAN…GULF OF MEXICO BTN 22N AND 24N.
.
TS IMPLY SEV OR GTR TURB SEV ICE LLWS AND IFR CONDS. SFC TO 400 MB.
.
SYNOPSIS…WK CDFNT EXTDS FM NR 28N60W TO 23N63W TO THE MONA PASSAGE. CDFNT WL MOV EWD AND WKN TODAY. EXP NARROW BAND OF CLDS WITH ISOL SHRA INVOF CDFNT.
.
SIGNIFICANT CLD/WX…
ERN MONTERREY FIR…NRN MERIDA FIR SCT025 SCT060. OTLK…VFR.
.
ATLC SWRN NEW YORK FIR…SAN JUAN FIR
NW OF CDFNT…SCT025 SCT060. LYR OCNL BKN. TOP 120. ISOL SHRA.
OTLK…VFR.
VCNTY CDFNT…SCT025 BKN060. OCNL BKN025. TOP 120. WDLY SCT
SHRA. ISOL TSRA TIL 20Z. OTLK…VFR SHRA.
SE OF CDFNT…SCT025 SCT060. ISOL SHRA. OTLK…VFR.
.
ATLC MIAMI FIR
SCT025 SCT060. LYR OCNL BKN. TOP 120. ISOL SHRA. OTLK…VFR.
.
WRN PIARCO FIR…NRN MAIQUETIA FIR…CURACAO FIR
BTN 61W-63W…SCT025 BKN060. OCNL BKN025. TOP 120. WDLY SCT
SHRA. OTLK…VFR SHRA.
RMNDR…SCT025 SCT060. ISOL SHRA. OTLK…VFR.
.
SANTO DOMINGO FIR…PORT-AU-PRINCE FIR
SCT025 SCT060. LYR OCNL BKN. TOP 120. ISOL SHRA. OTLK…VFR.
.
NRN BARRANQUILLA FIR…NRN PANAMA FIR
SCT025 SCT060. ISOL SHRA. SFC WND NE 20-25KT. OTLK…VFR.
.
KINGSTON FIR…NERN CNTRL AMERICAN FIR…HABANA FIR SCT025 SCT060. ISOL SHRA. OTLK…VFR.
.
ICE AND FRZLVL…
NO SGFNT ICE EXP OUTSIDE CNVTV ACT.
FRZLVL… 145-170.
.
TURB…
NO SGFNT TURB EXP OUTSIDE CNVTV ACT.
Alaska Graphical Forecasts
The NWS AAWU produces a series of graphical forecasts to complement the text-based FA for Alaska . These forecasts are available from the AAWU’s website. Forecasts include:
- Flying Weather,
- Surface Forecast,
- Icing Forecast,
- Turbulence Forecast, and
- Convective Outlook (seasonal product and only issued from May 1 through September 30).
Additional products may be available. Some of these may be labeled experimental; thus, the contents and format are subject to change.
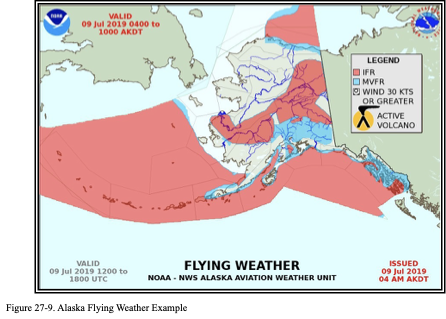
AAWU Flying Weather
The Flying Weather graphic (see Figure 27-9) includes flying weather conditions and any active volcanoes in Alaska. This product consists of two 6-hour forecasts valid for a total of 12 hours. Each forecast specifies where such conditions can be expected within the 6-hour valid time.
Areas of occasional or continuous MVFR/IFR are represented by shaded regions (red for IFR, blue for MVFR), whereas areas of predominately VFR weather are not shaded. MVFR/IFR conditions are possible outside these shaded regions, but only isolated in coverage. Strong surface winds are shown in a circle hatch overlay. Active volcanoes are denoted by a volcano symbol at the location of the volcano.
Note: This forecast is also referred to as the “IFR/MVFR” graphic on their website.
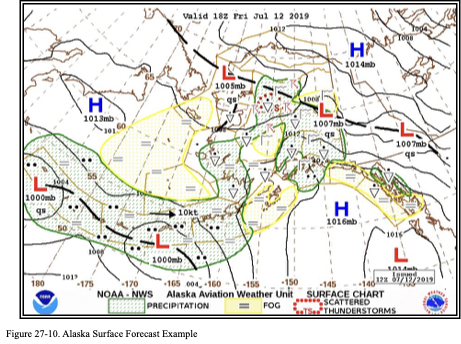
Alaska Surface Forecast
The Surface Forecast graphic (see Figure 27-10) illustrates prominent surface features, including sea level pressure, areas of high and low pressure, fronts and troughs, and precipitation. Each forecast shows the surface weather that can be expected within 1 hour of the designated time.
Areas of high pressure are depicted along with the maximum sea level pressure. Areas of low pressure are depicted with the minimum sea level pressure. The mean 12-hour motion of low pressure systems is also shown. Areas of occasional or continuous precipitation and/or fog are represented by shaded regions (green for precipitation, yellow for fog), whereas isolated or scattered precipitation is not shaded. This product is issued every 6 hours with forecasts valid for 00Z, 06Z, 12Z, and 18Z.
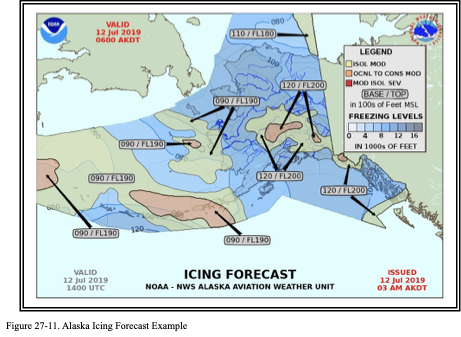
Alaska Icing Forecast
The Icing Forecast graphic (see Figure 27-11) provides information about freezing levels and the potential for significant icing at specified valid times.
Freezing level heights are blue-filled contours (every 2,000 ft). Areas of isolated (ISOL) moderate (MOD) icing are shaded yellow, areas of occasional (OCNL) or continuous (CONS) moderate icing are shaded orange, and red is used for moderate with isolated severe (SEV) icing (refer to SIGMETs for occasional or greater severe icing). These forecasts are issued every 8 hours and amended as needed.
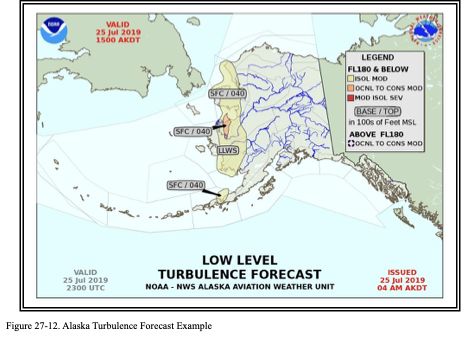
Alaska Turbulence Forecast
The Turbulence Forecast graphic (see Figure 27-12) depicts areas of significant turbulence at specified valid times.
Areas of isolated (ISOL) moderate (MOD) turbulence are shaded yellow, areas of occasional (OCNL) or continuous (CONS) moderate turbulence are shaded orange, and red is used for moderate with isolated severe (SEV) turbulence (refer to SIGMETs for occasional or greater severe turbulence).
Separate graphics are provided for low-level (defined for this product as FL180 and below) and high-level (defined for this product as above FL180) turbulence.
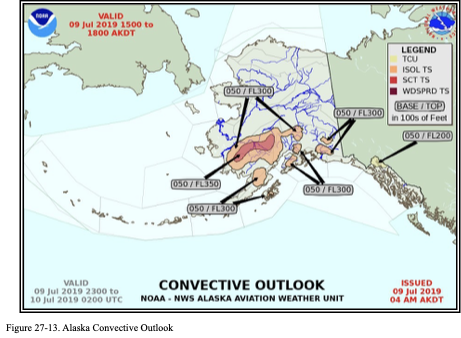
Alaska Convective Outlook
The Convective Outlook graphic (see Figure 27-13) is a seasonal product that provides information about convective activity at specific valid times. Each forecast indicates where conditions are favorable for the development of towering cumulus and thunderstorms.
Locations of towering cumulus are depicted in yellow. Locations of isolated (ISOL), scattered (SCT), and widespread (WDSPRD) thunderstorms (TS) are depicted in orange, red, and dark red, respectively. Cloud bases and tops are also depicted.
World Area Forecast System (WAFS)
ICAO’s WAFS supplies aviation users with global aeronautical meteorological en route forecasts suitable for use in flight-planning systems and flight documentation.
Two WAFCs, WAFC Washington and WAFC London, have the responsibility to issue the WAFS forecasts. WAFC Washington is operated by the NWS NCO in College Park, MD, and the NWS AWC in Kansas City, MO. WAFC London is operated by the United Kingdom’s Meteorological Office in Exeter, United Kingdom.
WAFS Forecasts
Both WAFC Washington and WAFC London issue the following WAFS forecasts in accordance with ICAO Annex 3, Meteorological Service for International Air Navigation.
- Global forecasts of:
- Upper wind and temperature (i.e., wind and temperature aloft, which is also issued in chart form for select areas);
- Upper-air humidity; o Geopotential altitude of FLs;
- FL and temperature of tropopause (i.e., tropopause forecast); o Direction, speed, and FL of maximum wind;
- Cumulonimbus clouds; o Icing; and o Turbulence.
- Global forecasts of SIGWX (i.e., High-Level SIGWX forecasts
- Select regional areas of Mid-Level SIGWX forecasts
Issuance
The WAFS forecasts of upper wind, temperature, and humidity; direction, speed, and FL of maximum wind; FL and temperature of tropopause; areas of cumulonimbus clouds; icing; turbulence; and geopotential altitude of FLs are issued four times a day by both WAFC Washington and WAFC London.
These forecasts are produced from weather computer models and are not modified by WAFC forecasters. WAFC Washington’s forecast is from the Global Forecast System (GFS) model. These forecasts are issued in grid-point format (i.e., WMO GRIdded Binary, Edition 2 (GRIB2) format).
These forecasts are valid for fixed valid times at 6, 9, 12, 15, 18, 21, 24, 27, 30, 33, and 36 hours after the time (0000, 0600, 1200, and 1800 UTC) on which the forecasts were based. Additional valid times are planned to be implemented in 2024.
WAFS Wind and Temperature Forecasts
Wind and temperature forecasts are issued for FLs 050 (850 mb), 100 (700 mb), 140 (600 mb), 180 (500 mb), 240 (400 mb), 270 (350 mb), 300 (300 mb), 320 (275 mb), 340 (250 mb), 360 (225 mb), 390 (200 mb), 410 (175 mb), 450 (150 mb), and 530 (100 mb). Additional levels are planned to be implemented in 2024.
Note: ICAO uses FLs below 18,000 MSL for global weather products.
WAFC wind and temperature forecasts use a plotting model where the air temperature (degrees Celsius) is the center of the data point and the wind direction and speed follows the standard model (see Figure 27-14) with the exception that wind speed for points in the Southern Hemisphere is flipped. Note the data points do not correspond to any airports or reference points with names or identifiers.
WAFS global wind and temperature forecasts are provided in grid point format (e.g., computer format) for use in flight-planning systems. Chart format is also provided on the AWC’s website in the User Tools under “Flight Folder.”
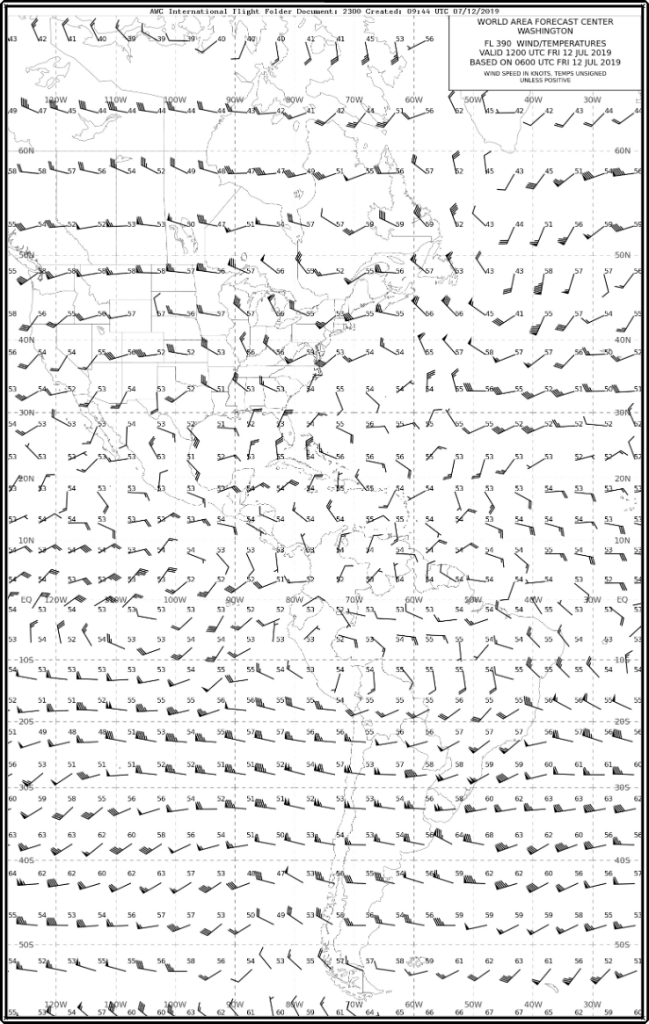
Figure 27-14. WAFS Wind and Temperature 6-Hour Forecast at FL390—Example
Humidity, Maximum Wind, and Tropopause Forecasts
No specific charts are issued for global upper-air humidity, maximum wind, height of tropopause, and altitude of FLs. These products are provided in grid point format (e.g., computer format) for use in flight-planning systems. Data from these forecasts are used by the WAFC forecasters to produce the High-Level and Medium-Level SIGWX forecasts, which contain tropopause and jet stream forecasts.
Humidity data is produced for FLs 50 (850 mb), 100 (700 mb), 140 (600 mb), and 180 (500 mb). Additional valid times are planned to be implemented in 2024.
WAFS Turbulence, Icing, and Cumulonimbus Cloud Forecasts
WAFS global turbulence, icing, and cumulonimbus cloud forecasts are provided in grid point format (e.g., computer format) for use in flight-planning systems, but the AWC does make these available on their website in web display format and not chart format. The web display allows the user to select various products and FLs and view the forecasts as single time steps or in a movie-loop sequence. More detailed information is provided on the AWC’s website under “WAFS Forecasts.”
The WAFS global turbulence, icing, and cumulonimbus cloud forecasts are actually a blend of the WAFC Washington global turbulence, icing, and cumulonimbus cloud forecasts and the WAFC London global turbulence, icing, and cumulonimbus cloud forecasts. In other words, each WAFC produces their own global turbulence, icing, and cumulonimbus cloud forecasts using their own global computer models (WAFC Washington uses the NCEP’s GFS model). The two WAFCs’ forecasts, for turbulence, icing, and cumulonimbus cloud only, are then merged together to eliminate any differences between the two sets of forecasts.
Significant Weather (SIGWX)
SIGWX forecasts may be depicted in monochrome or color display. The colors used for symbols as well as the color and style of lines are not standard. The colors of jet streams, turbulence, cloud cover, and other elements may vary depending on the website and service provider. The examples shown in this section are from the NWS AWC’s and the AAWU’s websites. Refer to any legend, Help Page, or user information on the websites for details on the content and display of the weather information.
Low-Level Significant Weather (SIGWX) Charts
The Low-Level SIGWX Charts (see Figure 27-15) provide an overview of selected aviation weather hazards up to FL240 at 12 and 24 hours into the future.
The forecast domain covers the CONUS and the coastal waters. Each depicts a “snapshot” of weather expected at the specified valid time.
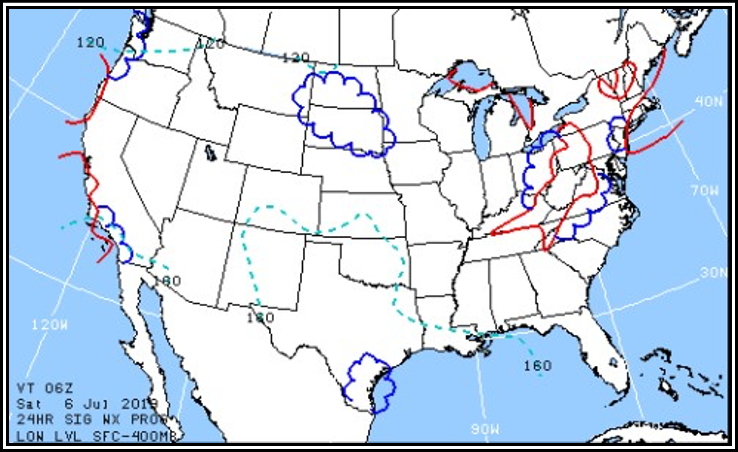
Figure -Hour Low-Level SIGWX Chart—Example
Issuance
Low-Level SIGWX Charts are issued four times per day by the NWS AWC (see Table 27-10). Two charts are issued: a 12-hour and a 24-hour prognostic (prog) chart.
Table 27-10. Low-Level SIGWX Chart Issuance Schedule
| Issuance Time | ||||
| ~1720Z | ~2310Z | ~0530Z | ~0935Z | |
| Chart | Valid Time | |||
| 12-Hour Prog | 00Z | 06Z | 12Z | 18Z |
| 24-Hour Prog | 12Z | 18Z | 00Z | 06Z |
Content
Low-Level SIGWX Charts depict weather flying categories, turbulence, and freezing levels (see Figure 27-16). In-flight icing is not depicted on the Low-Level SIGWX Chart.
Depending on the website or service provider, the Low-Level SIGWX Charts may be combined with Surface Prog Charts to create a four-panel presentation. For example, the left two panels represent the 12-hour forecast interval and the right two panels represent the 24-hour forecast interval. The upper two panels depict the SIGWX Charts and the lower two panels the Surface Prog.
Note: The colors used in the Low-Level SIGWX Charts may vary depending on the website or service provider.
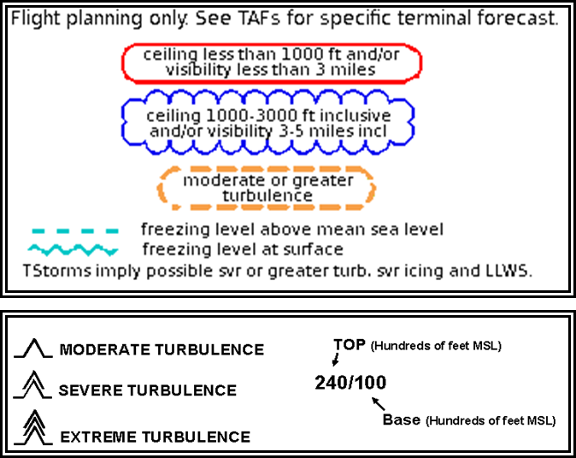
Low-Level SIGWX Chart Symbols
Flying Categories
IFR areas are outlined with a solid red line, MVFR areas are outlined with a scalloped blue line, and VFR areas are not depicted (see Figure 27-17).
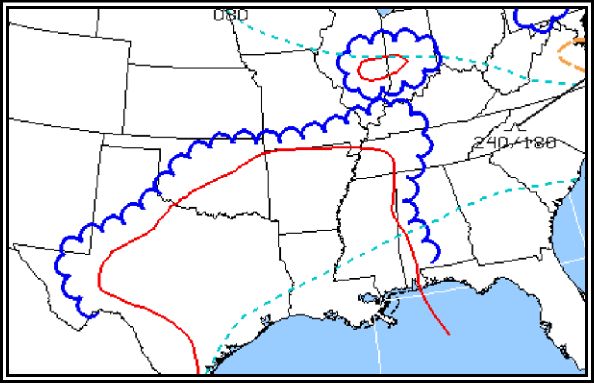
Figure 27-17. Low-Level SIGWX Chart Flying Categories—Example
Turbulence
Areas of moderate or greater turbulence are enclosed by bold, dashed, brown lines (see Figure 27-18). Turbulence intensities are identified by standard symbols (see Figure 27-16). The vertical extent of turbulence layers is specified by top and base heights separated by a slant. The intensity symbols and height information may be located within or adjacent to the forecasted areas of turbulence. If located adjacent to an area, an arrow will point to the associated area. Turbulence height is depicted by two numbers separated by a solidus (/). For example, an area on the chart with turbulence indicated as 240/100 indicates that the turbulence can be expected from the top at FL240 to the base at 10,000 ft MSL. When the base height is omitted, the turbulence is forecast to reach the surface. For example, 080/ identifies a turbulence layer from the surface to 8,000 ft MSL. Turbulence associated with thunderstorms is not depicted on the chart.
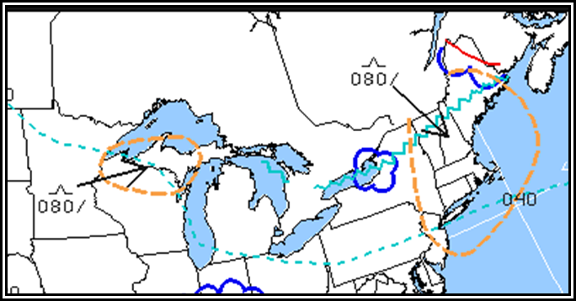
Figure 27-18. Low-Level SIGWX Chart Turbulence Forecast—Example
Freezing Levels
The freezing level at the surface is depicted by a blue, saw-toothed symbol (see Figure 27-19). The surface freezing level separates above-freezing from below-freezing temperatures at the Earth’s surface.
Freezing levels above the surface are depicted by blue dashed lines labeled in hundreds of feet MSL beginning at 4,000 ft using 4,000-ft intervals (see Figure 27-19). If multiple freezing levels exist, these lines are drawn to the highest freezing level. For example, 80 identifies the 8,000-ft freezing level contour (see Figure 27-19). The lines are discontinued where they intersect the surface.
The freezing level for locations between lines is determined by interpolation. For example, the freezing level midway between the 4,000 and 8,000-ft lines is 6,000 ft.
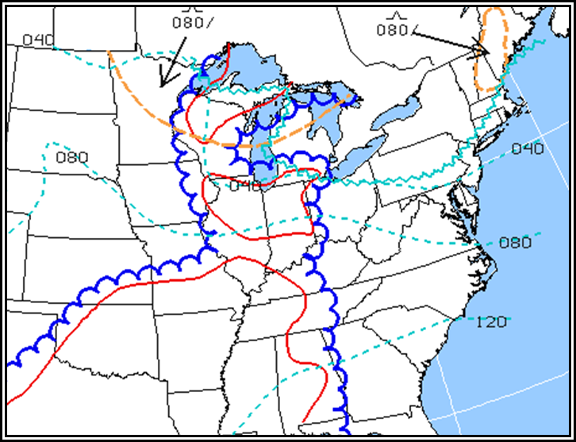
Figure Low-Level SIGWX Chart Freezing Level Forecast—Example
Multiple freezing levels occur when the temperature is 0 ºC at more than one altitude aloft (see Figure 27-20). Multiple freezing levels can be forecasted on the Low-Level SIGWX Prog Charts in situations where the temperature is below freezing (negative) at the surface with multiple freezing levels aloft.
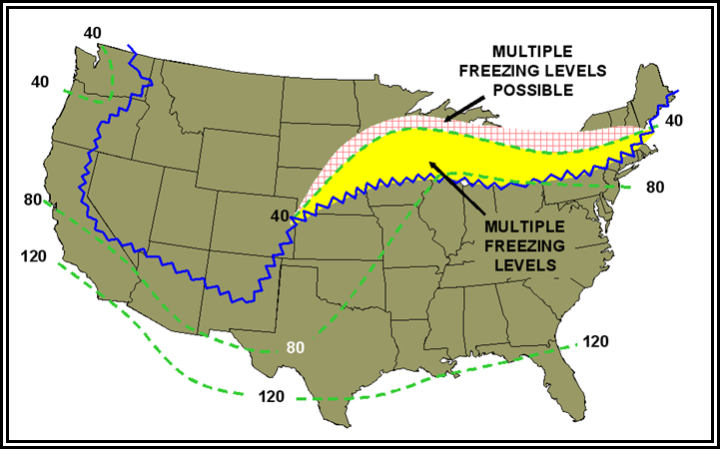
The words “Multiple Freezing Levels Possible” and/or “Multiple Freezing Levels,” and/or associated shading and hatched area do not appear on the chart. Note: The colors used in this example are different from those used in other examples.
Figure 27-20. Low-Level SIGWX Chart Multiple Freezing Levels—Example
In Figure 27-20, areas with multiple freezing levels are located on the below-freezing side of the surface freezing level contour and bounded by the 4,000-ft freezing level. Multiple freezing levels are possible beyond the 4,000-ft freezing level (i.e., below 4,000 ft MSL), but the exact cutoff cannot be determined.
Mid-Level Significant Weather (SIGWX) Chart
The Mid-Level SIGWX Chart (see Figure 27-21) is a product of ICAO’s WAFS. The Mid-Level SIGWX Chart is also known as the Medium-Level SIGWX Chart. The Mid-Level SIGWX Chart is planned to be phased out in 2024 and replaced by new WAFS SIGWX forecasts. The Mid-Level SIGWX Chart provides a forecast of significant en route weather phenomena over a range of FLs from 10,000 ft MSL to FL450. The chart depicts a “snapshot” of weather expected at the specified valid time. It can be used by airline dispatchers for flight planning and weather briefings before departure and by flightcrew members during flight.
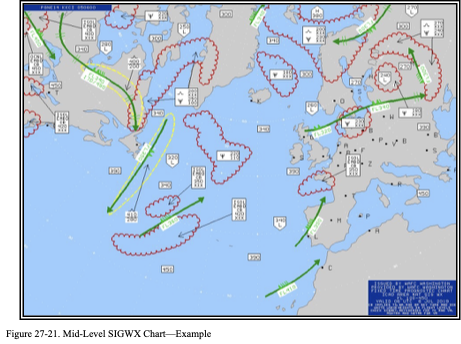
Issuance
The AWC in Kansas City, MO, has the responsibility, as part of the WAFC Washington, to provide global weather forecasts of SIGWX phenomena. The AWC issues a 24-hour Mid-Level SIGWX Chart, four times daily, for the North Atlantic Ocean Region (see Table 27-11).
Table 27-11. Mid-Level SIGWX Chart Issuance Schedule
| Issued (UTC) | Valid (UTC) |
| 0800 | 0000 (next day) |
| 1400 | 0600 (next day) |
| 2000 | 1200 (next day) |
| 0200 | 1800 |
Content
The Mid-Level SIGWX Chart depicts numerous weather elements that can be hazardous to aviation. The weather elements and their presentation are the same as in the High-Level SIGWX Charts except for the addition of nonconvective clouds with moderate or severe icing and/or moderate or severe turbulence. See Section for details on these other weather elements.
Nonconvective Clouds with Moderate or Severe Icing and/or Moderate or Severe Turbulence
Areas of nonconvective clouds with moderate or severe icing and/or moderate or severe turbulence are depicted by enclosed (red) scalloped lines (see Figure 27-21). The type of icing (i.e., rime, clear, or mixed) is not forecast.
Note: Cumulonimbus clouds are also depicted by enclosed (red) scalloped lines.
The identification and characterization of each area appears within or adjacent to the outlined area. If the identification and characterization is adjacent to an outlined area, an arrow points to the appropriate area.
The identification box uses the standard icing symbol (see Table 27-12). The vertical extent of the icing layer is specified by top and base heights. When the bases extend below 10,000 ft MSL, they are identified with XXX. Table 27-12. Icing and Turbulence Intensity Symbols
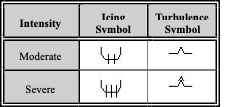
High-Level Significant Weather (SIGWX) Charts
High-Level SIGWX Charts (see Figure 27-22) provide a forecast of significant en route weather phenomena over a range of FLs from FL250 to FL630. Each chart depicts a “snapshot” of weather expected at the specified valid time. The vertical range is planned to change in 2024 to FL100 to FL600 with the planned implementation of new WAFS SIGWX forecasts, which will have 3-hour time steps (valid times) from 0 to 48 hours. High-Level SIGWX forecasts are provided for the en route portion of international flights. These products are used by airline dispatchers for flight planning and weather briefings before departure and by flightcrew members during flight.
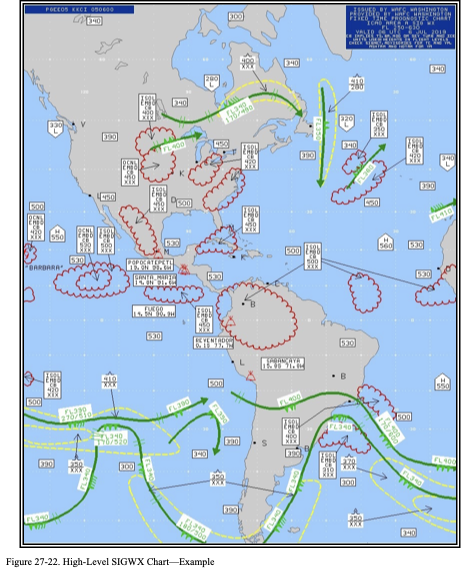
Issuance
In accordance with the WAFS of ICAO, High-Level SIGWX forecasts are provided for the en route portion of international flights.
High-Level SIGWX forecasts are issued as a global data set in digital format by two WAFCs, one at the NWS AWC and the other at the United Kingdom’s Meteorological Office. Each center produces a global data set of SIGWX that is then made available (displayed) in chart form for different areas of the globe. These charts are available on the AWC’s website.
Corrections are issued for format errors or missing information. These charts are not amended.
Table 27-13 provides the issuance schedule.
Table 27-13. High-Level SIGWX Forecast Issuance Schedule
| Issued (UTC) | Valid (UTC) |
| 0800 | 0000 (next day) |
| 1400 | 0600 (next day) |
| 2000 | 1200 (next day) |
| 0200 | 1800 |
Content
Thunderstorms and Cumulonimbus Clouds
The abbreviation CB is only included where it refers to the expected occurrence of an area of widespread cumulonimbus clouds, cumulonimbus along a line with little or no space between individual clouds, cumulonimbus embedded in cloud layers, or cumulonimbus concealed by haze. It does not refer to isolated cumulonimbus not embedded in cloud layers or concealed by haze.
Each cumulonimbus area is identified with CB and characterized by coverage, bases, and tops.
Coverage is identified as isolated (ISOL) meaning less than 4/8, occasional (OCNL) meaning 4/8 to 6/8, and frequent (FRQ) meaning more than 6/8 coverage. Isolated CBs can only be depicted when they are embedded (EMBD) in clouds or concealed by haze. Occasional cumulonimbus can be depicted with or without EMBD.
The vertical extent of cumulonimbus layer is specified by top and base heights. Bases that extend below FL250 (the lowest altitude limit of the chart) are encoded XXX.
Cumulonimbus are depicted by enclosed (red) scalloped lines. The identification and characterization of each cumulonimbus area will appear within or adjacent to the outlined area. If the identification and characterization is adjacent to an outlined area, an arrow will point to the associated cumulonimbus area.
On SIGWX charts, the inclusion of CB shall be understood to include all weather phenomena normally associated with cumulonimbus (e.g., thunderstorm, moderate or severe icing, moderate or severe turbulence, and hail).
Moderate or Severe Turbulence
Forecast areas of moderate or severe turbulence (see Figure 27-23) associated with wind shear zones and/or mountain waves are enclosed by bold yellow dashed lines. Intensities are identified by standard symbols (see Table 27-12).
The vertical extent of turbulence layers is specified by top and base heights, separated by a horizontal line. Turbulence bases that extend below FL250 are identified with XXX.
Convective or thunderstorm turbulence is not identified.
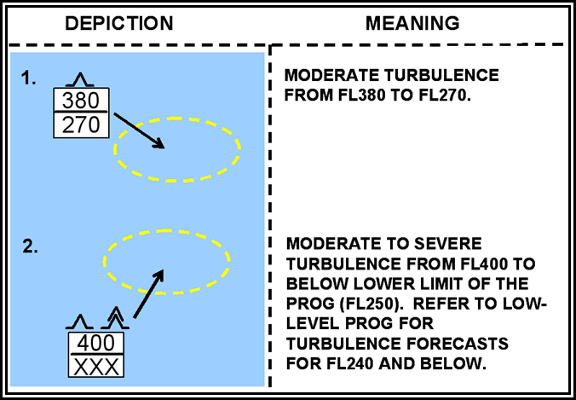
Figure High-Level SIGWX Chart Turbulence—Examples
Moderate or Severe Icing
Moderate or severe icing (outside of thunderstorms) above FL240 is rare and is not generally forecasted on High-Level SIGWX Charts.
Jet Streams
A jet stream axis with a wind speed of more than 80 kt is identified by a bold (green) line. An arrowhead is used to indicate wind direction. Wind change bars (double-hatched, light green lines) positioned along a jet stream axis identify 20-kt wind speed changes
Symbols and altitudes are used to further characterize a jet stream axis. A standard wind symbol (light green) is placed at each pertinent position to identify wind velocity. The FL is placed adjacent to each wind symbol to identify the altitude of the jet stream core or axis. Jet stream vertical depth forecasts are included when the maximum speed is 120 kt or more. Jet depth is defined as the vertical depths to the 80-kt wind field above and below the jet stream axis using FLs. Jet depth information is placed at the maximum speed point only, normally at one point on each jet stream. When the jet stream is very long and there are several wind maxima, then each maximum should include forecasts of the vertical depth.
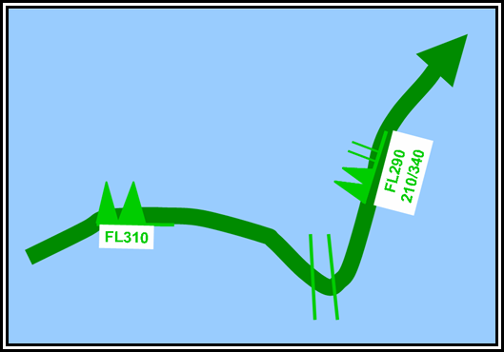
Forecast maximum speeds of 100 kt at FL310 at one location and 120 kt at FL290 at another location. At the latter location, the base of the 80-kt wind field is FL210, and the top of the 80-kt wind field is FL340.
Figure 27-24. High-Level SIGWX Chart Jet Stream—Example
Tropopause Heights
Tropopause heights are plotted at selected locations on the chart. They are enclosed by rectangles and plotted in hundreds of feet MSL (see Figure 27-25). Centers of high (H) and low (L) tropopause heights are enclosed by polygons and plotted in hundreds of feet MSL.
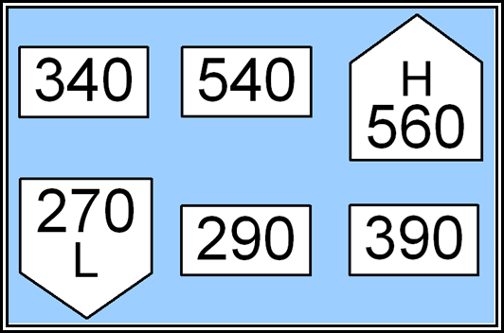
Figure 27-25. High-Level SIGWX Chart Tropopause Height—Examples
Tropical Cyclones
Tropical cyclones (i.e., with surface wind speed 34 kt or greater) are depicted by the symbol in Figure 27-26 with the storm’s name positioned adjacent to the symbol. Cumulonimbus clouds meeting chart criteria are identified and characterized relative to each storm.
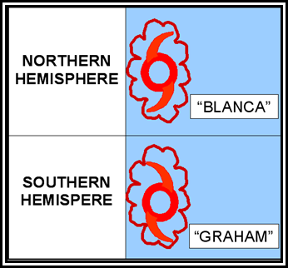
Figure 27-26. High-Level SIGWX Chart Tropical Cyclone—Examples
Volcanic Eruption Sites
Volcanic eruption sites are identified by a trapezoidal symbol depicted The dot on the base of the trapezoid identifies the location of the volcano. The name of the volcano, its latitude, and its longitude are noted adjacent to the symbol.
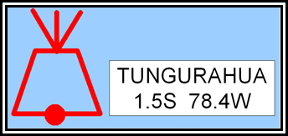
Figure High-Level SIGWX Chart Volcanic Eruption Site—Example
Alaska Significant Weather (SIGWX) Charts
The Alaska SIGWX Charts (see Figure 27-28) are a series of four forecasts (24-hour, 36-hour, 48-hour, and 60-hour) valid at specified times. These charts provide a graphical overview of the specified forecast weather primarily for lower flight altitudes.
Issuance
The AAWU issues the Alaska SIGWX Charts (see Figure 27-28). These charts are issued twice a day at 0530 and 1330 UTC during Alaska Standard Time, and 0430 and 1230 UTC during Alaska Daylight Time. The 1330/1230 UTC-issued 24-hour SIGWX chart may be updated around 2145/2045 UTC valid at 1200 UTC the next day.
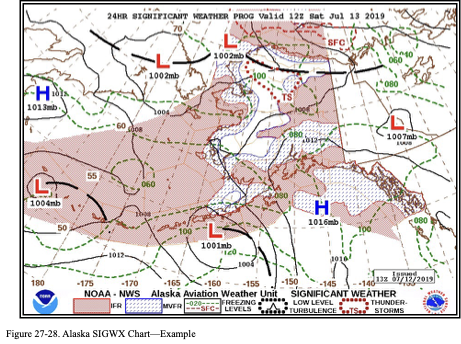
Content
Surface Pressure Systems and Fronts
Pressure systems and fronts are depicted using standard symbols. Isobars are denoted by solid, thin black lines and labeled with the appropriate pressure in millibars. The central pressure is plotted near the respective pressure center.
Areas of IFR and MVFR Weather Conditions
Areas of forecast IFR and MVFR conditions are shown in red and blue hatching, respectively.
Freezing Levels
Forecast freezing levels are depicted for the surface (dashed red line) and at 2,000-ft intervals (dashed green lines).
Note: Areas of in-flight icing forecasts are not included in the Alaska SIGWX forecasts.
Low-Level Turbulence
Areas of forecast moderate or greater nonconvective low-level turbulence are depicted with black dots. Turbulence altitudes are not included but can be considered as turbulence that is near the surface as a result of wind interactions with the terrain. In most cases, it would be within 6,000 ft above the terrain.
Thunderstorms
Areas of forecast thunderstorms are depicted with red dots. Thunderstorm areal coverage, cloud bases, and tops are not included.
Short-Range Surface Prognostic (Prog) Charts
The NWS WPC provides Short-Range Surface Prog Charts (see Figure 27-29) of surface pressure systems, fronts, and precipitation for a multiday period. The forecast area covers the CONUS and coastal waters. The forecasted conditions are divided into selected forecast valid time periods. Each chart depicts a “snapshot” of weather elements expected at the specified valid time.
The Short-Range Surface Prog Charts combine WPC forecasts of fronts, isobars, and high/low pressure systems with the NWS’ National Digital Forecast Database (NDFD) digital forecasts from the NWS WFO. The Short-Range Surface Prog Forecasts are issued by the WPC in College Park, MD.
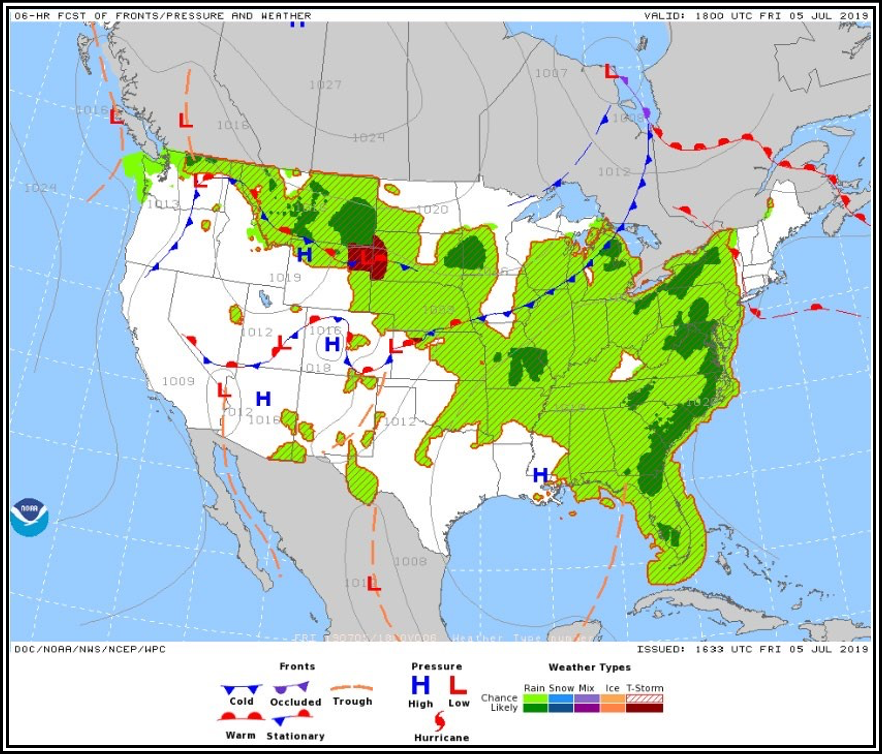
Figure NDFD Short-Range Surface Prog Forecast—Example
Content
Precipitation
The Short-Range Surface Prog Forecast provides precipitation forecasts in the following depiction:
- NDFD Rain (Chance—light green):–There is a 25 to less than 55 percent probability of measurable rain (≥0.01 in) at the valid time.
- NDFD Rain (Likely—dark green): There is a greater than or equal to 55 percent probability for measurable rain (≥0.01 in) at the valid time.
- NDFD Snow (Chance—light blue): There is a 25 to less than 55 percent probability of measurable snowfall (≥0.01 in liquid equivalent) at the valid time.
- NDFD Snow (Likely—dark blue): There is a greater than or equal to 55 percent probability of measurable snow (≥0.01 in liquid equivalent) at the valid time.
- NDFD Mix (Chance—light purple): There is a 25 to less than 55 percent probability of measurable mixed precipitation (≥0.01 in liquid equivalent) at the valid time. “Mix” can refer to precipitation where a combination of rain and snow, rain and sleet, or snow and sleet are forecast.
- NDFD Mix (Likely—dark purple): There is a greater than or equal to 55 percent probability of measurable mixed precipitation (≥0.01 in liquid equivalent) at the valid time. “Mix” can refer to precipitation where a combination of rain and snow, rain and sleet, or snow and sleet are forecast.
- NDFD Ice (Chance—light brown): There is a 25 to less than 55 percent probability of measurable freezing rain (≥0.01 in) at the valid time.
- NDFD Ice (Likely—brown): There is a greater than or equal to 55 percent probability of measurable freezing rain (≥0.01 in) at the valid time.
- NDFD T-Storm (Chance—red hatching): There is a 25 to less than 55 percent probability of thunderstorms at the valid time. Areas are displayed with diagonal red hatching enclosed in a red border.
- NDFD T-Storm (Likely and/or Severe—dark red): There is a greater than or equal to 55 percent probability of thunderstorms, and/or the potential exists for some storms to reach severe levels at the valid time.
Symbols
Figure 27-30 shows the Surface Prog Forecast symbols.
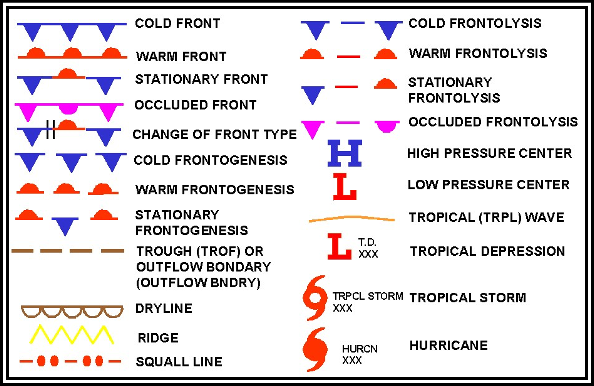
Figure Surface Prog Forecast Symbols
Pressure Systems
Pressure systems are depicted by pressure centers, troughs, isobars, drylines, tropical waves, tropical storms, and hurricanes using standard symbols (see Figure 27-30). Isobars are denoted by solid, thin black lines and labeled with the appropriate pressure in millibars. The central pressure is plotted near the respective pressure center.
Fronts
Fronts are depicted using the standard symbols in Figure 27-30.
Squall Lines
Squall lines are denoted using the standard symbol in Figure 27-30.
Upper-Air Forecasts
NWP models, run on supercomputers, generate surface and upper-air forecasts, known as “Model Guidance” to meteorologists. The NWS NCO runs several models daily and produces hundreds of surface and upper-air guidance products, valid from model run time (i.e., 00-hour) out to several days or weeks (e.g., 340 hours after model run time) depending on the model. Their “Model Analyses and Guidance” website (see Figure 27-31) contains a user’s guide as well as a product description link that provides details on the various products.
A user’s guide, located below the image (lower left), provides descriptions, details, and examples of the various products.
Figure NWS NCO Model Analyses and Guidance Website
Constant Pressure Level Forecasts
Constant pressure level forecasts (see Figure 27-32) are just one of the many products produced by NWP models. Constant pressure level forecasts are the computer model’s depiction of select weather (e.g., wind) at a specified constant pressure level (e.g., 300 mb), along with the altitudes (in meters) of the specified constant pressure level. When considered together, constant pressure level forecasts describe the 3D aspect of pressure systems. Each product provides a plan-projection view of a specified pressure altitude at a given forecast time.
Constant pressure level forecasts are used to provide an overview of weather patterns at specified times and pressure altitudes and are the source for wind and temperature aloft forecasts. Pressure patterns cause and characterize much of the weather. Typically, lows and troughs are associated with clouds and precipitation while highs and ridges are associated with fair weather, except in winter when valley fog may occur. The loclocation and strength of the jet stream can be viewed at 300 mb, 250 mb, and 200 mb levels.
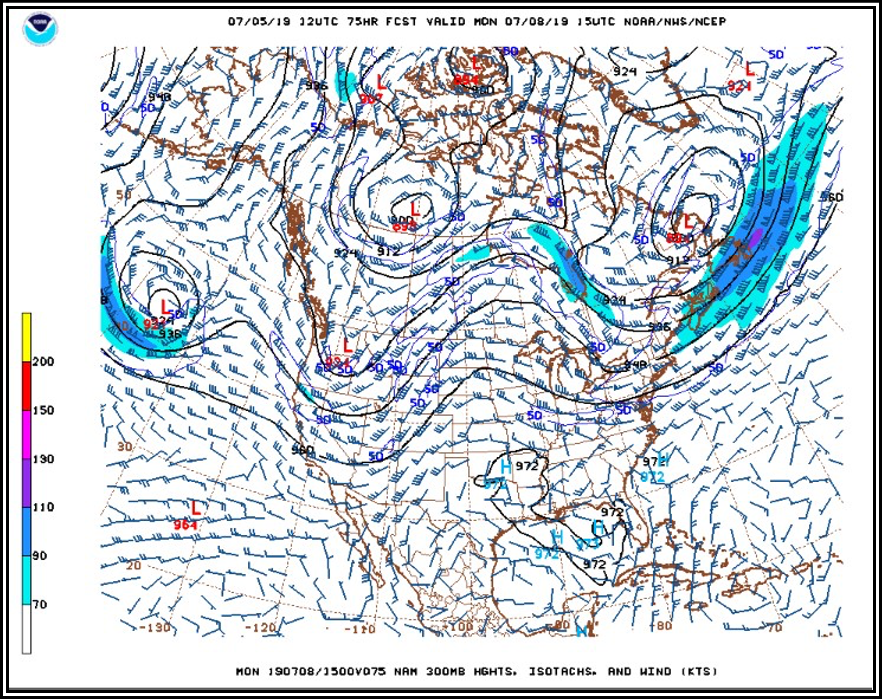
Contours of the height of the 300 mb surface are presented as solid lines. Windbarbs are used to show the direction and speed of the wind. Shading is done for wind speeds greater than 70 kt and generally represents the jet stream.
Figure 27-32. 300 mb Constant Pressure Forecast—Example
Issuance
Constant pressure level forecasts are produced several times a day depending on the model. The NCEP’s GFS model and North American Model (NAM) produce forecasts four times per day, with initial times of 00, 06, 12, and 18 UTC. Other higher resolution models such as the High Resolution Rapid Refresh (HRRR) produce forecasts at hourly intervals.
Content
Constant pressure level forecasts vary in content depending on the selected model and product. Most provide a wind forecast that may be combined with temperature, relative humidity, or certain derived parameters (e.g., vorticity).
Many constant pressure levels are available for display, depending on the model. For example, the NCEP’s “Model Analyses and Guidance” website (see Figure 27-31) provides displays of the NCEP’s GFS model constant pressure levels contained in Table 27-14. It should be noted that the levels provided on the website are only a subset of the levels available from the model that are routinely made available to NWS meteorologists and others (e.g., 400 mb, 600 mb).
Table 27-14. Select Constant Pressure Levels from the GFS Model
| Constant Pressure Level | Approximate Altitude (MSL) |
| 925 mb | 2,500 |
| 850 mb | 5,000 |
| 700 mb | 10,000 |
| 500 mb | 18,000 |
| 300 mb | 30,000 |
| 250 mb | 34,000 |
| 200 mb | 39,000 |
Freezing Level Forecast Graphics
The freezing level forecast graphics provide an initial analysis and forecasts at specified times into the future. The forecasts are based on output from NWS computer models. They supplement the forecast freezing level information contained in the icing AIRMETs.
The freezing level is the lowest altitude in the atmosphere over a given location at which the air temperature reaches 0 °C. This altitude is also known as the height of the 0 °C constant-temperature surface. A freezing level forecast graphic (see Figure 27-33) shows the height of the 0 °C constant-temperature surface.
The initial analysis and forecast graphics are updated hourly. The colors represent the height in hundreds of feet above MSL of the lowest freezing level. Regions with white indicate the surface and the entire depth of the atmosphere are below freezing. Hatched or spotted regions (if present) represent areas where the surface temperature is below freezing with multiple freezing levels aloft.
More information on the freezing level forecast graphics is available on the AWC’s website.
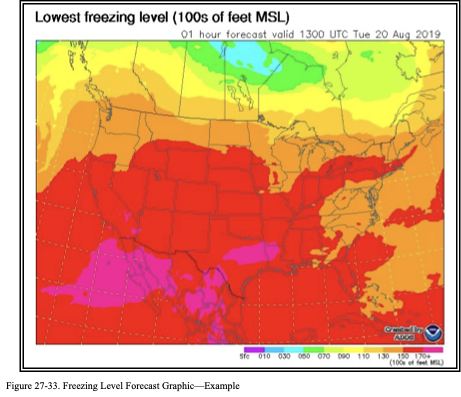
Forecast Icing Product (FIP)
The NWS produces icing products that are derived from NWS computer model data and PIREPs with no forecaster modifications. This includes the following products: • The CIP, and
• The FIP.
The FIP provides the same suite of products as the CIP (see Section 25.5), describing the icing environment in the future and being solely NWP model based. Information on the graphics is determined from NWP model output; observational data, including WSR-88D; satellite, PIREPs, and surface weather reports; and lightning network data.
FIPs contain a heavy intensity level. Heavy icing has been defined, in part, as the rate of ice accumulation that requires maximum use of ice protection systems to minimize ice accretions on the airframe. Heavy icing is not an intensity level used in PIREPs.
FIPs will continue to evolve over the coming years with increased model resolutions, additional horizontal layers, and improvements to the algorithms and/or data sets used to produce the products. Along with these improvements may come a change in references to the product update version. Users can find additional information on these products and any changes on the AWC’s “Icing” web page.
The FIP suite as it appears on the AWC’s website consists of five graphics, including:
- Icing Probability;
- Icing Severity;
- Icing Severity—Probability > 25 percent; • Icing Severity—Probability > 50 percent; and
- Icing Severity plus SLD.
The CIPs/FIPs are generated for select altitudes from 1,000 ft MSL to FL300. FIPs are available at select forecast times through 18 hours.
The CIPs/FIPs can be viewed at single altitudes and FLs or as a composite of all altitudes from 1,000 ft MSL to FL300, which is referred to as the “maximum” or “max.”
The FIP should be used in conjunction with the report and forecast information contained in an AIRMET and SIGMET.
Icing Probability
The Icing Probability product displays the probability of icing at any level of intensity. Probabilities range from 0 percent (no icing expected) to 85 percent or greater (nearly certain icing). The product is available in single altitudes (e.g., 3,000 ft MSL) or a composite of all altitudes from 1,000 ft MSL to FL300.
Icing Severity
The Icing Severity product depicts the icing intensity likelihood at locations where the Icing Probability product depicts possible icing. Icing intensity is displayed using icing intensity categories: trace, light, moderate, and heavy. The product is available in single altitudes (e.g., 17,000 ft MSL) or a composite of all altitudes from 1,000 ft MSL to FL300 (i.e., max level).
Icing Severity—Probability > 25 Percent
The Icing Severity—Probability > 25 percent product depicts icing intensity where at least a 26 percent probability exists for any icing intensity. Icing intensity is displayed using icing intensity categories: trace, light, moderate, and heavy. The product is available in single altitudes (e.g., 3,000 ft MSL) or a composite of all altitudes from 1,000 ft MSL to FL300 (i.e., max level).
Icing Severity—Probability > 50 Percent
The Icing Severity—Probability > 50 percent product depicts icing intensity where at least a 51 percent probability exists for any icing intensity. Icing intensity is displayed using icing intensity categories: trace, light, moderate, and heavy. The product is available in single altitudes (e.g., 3,000 ft MSL) or a composite of all altitudes from 1,000 ft MSL to FL300 (i.e., max level).
Icing Severity Plus SLD
The Icing Severity plus SLD product depicts the intensity of icing expected as well as locations where a threat for SLD exists. The product is available in single altitudes (e.g., 3,000 ft MSL) or a composite of all altitudes from 1,000 ft MSL to FL300 (i.e., max level
SLD is defined as supercooled water droplets larger than 50 micrometers in diameter. These size droplets include freezing drizzle and/or freezing rain aloft.
Icing intensity is displayed using icing intensity categories: trace, light, moderate, and heavy.
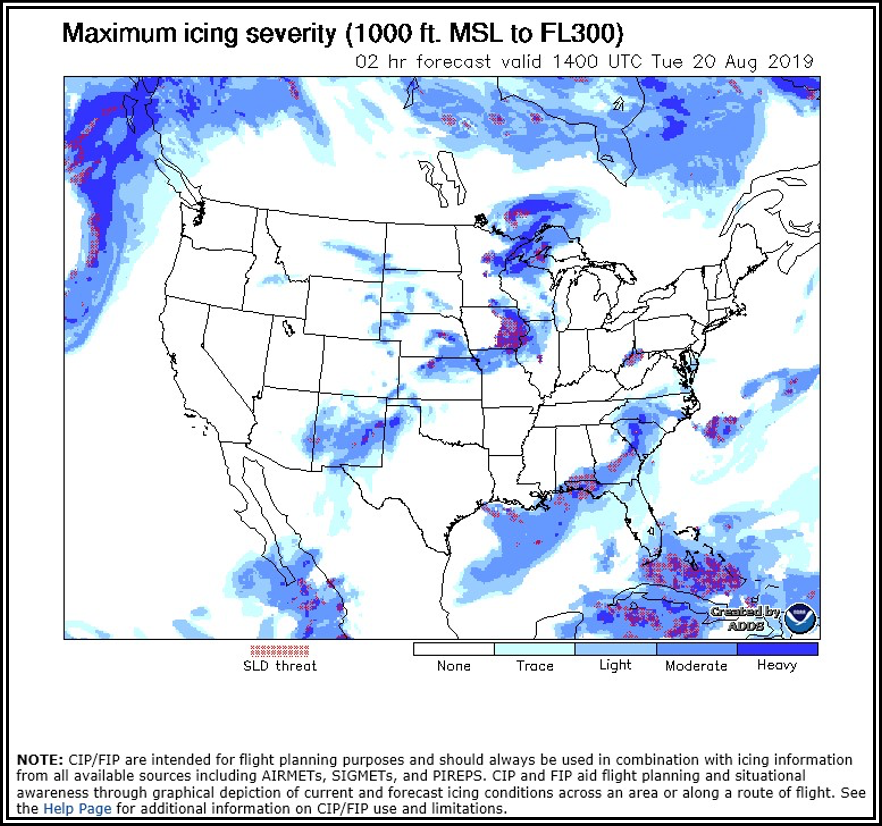
Figure FIP Icing Severity Plus SLD—Max Example
Graphical Turbulence Guidance (GTG)
The NWS produces a turbulence product that is derived from airborne turbulence observations and NWS model data with no forecaster modifications. This product is GTG.
GTG computes the results from more than 10 turbulence algorithms, then compares the results of each algorithm with turbulence observations from both PIREPs and AMDAR data to determine how well each algorithm matches reported turbulence conditions from these sources. GTG then weighs the results of this comparison to produce a single turbulence forecast. Note that the success of GTG is proportional to the number of PIREPs and AMDAR reports available to verify the algorithms. This means the accuracy of GTG improves during daylight hours and where there is more traffic making PIREPs and sending of AMDAR data. GTG produces its forecasts every hour. Currently, GTG has separate forecasts for each hour through the first 3 hours, followed by forecasts at 3-hour intervals through 18 hours. GTG forecasts are available at select altitudes from 1,000 ft MSL through FL450. GTG forecasts are also scaled to three ICAO weight class sizes for aircraft, with light-sized aircraft being less than 15,500 lb, heavy-sized aircraft being more than 300,000 lb, and medium-sized in between.
See Figure 27-35 for an example of a GTG forecast for CAT and Mountain Wave Turbulence (MWT).
GTG does not specifically predict turbulence associated with convective clouds or small-scale local terrain features, but it does predict turbulence associated with upper-level clear and mountain wave sources.
GTG provides three depictions of turbulence:
- CAT,
- MWT, and
- Combined Turbulence (the Combined GTG product depicts the higher of CAT values and MWT values at any given point).
This turbulence product will continue to evolve over the coming years with increased model resolutions, additional horizontal layers, and improvements to the algorithms and/or data sets used to produce the product. Users can find additional information on these products and any changes on the AWC’s “Turbulence” web page.
The GTG product suite is issued and updated every hour by the AWC and is available on the AWC’s website and other sources.
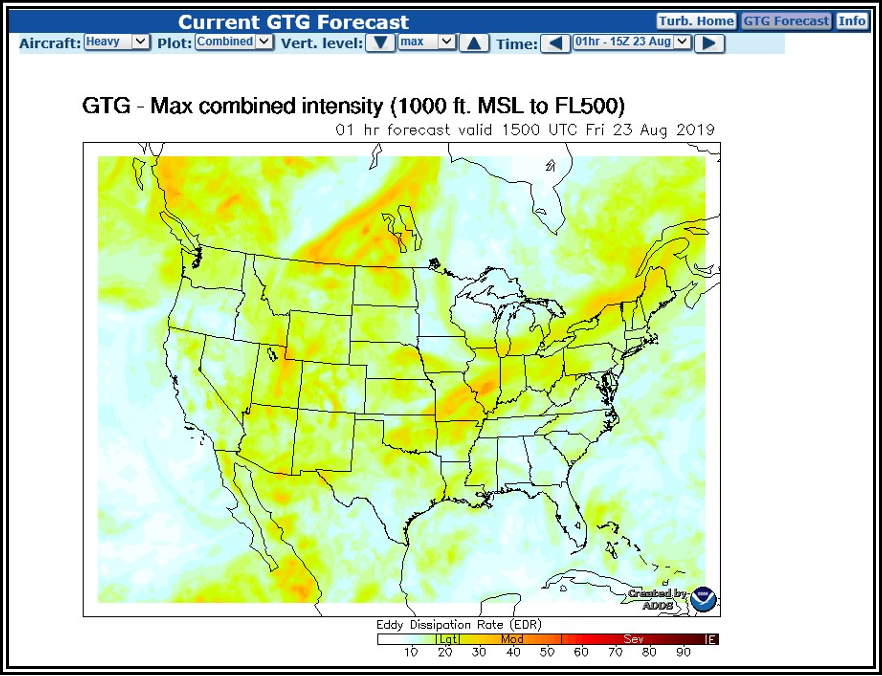
Figure GTG Forecast—Max Intensity (CAT+MWT All Levels) Example
Cloud Tops
The Cloud Tops product is one of the products transmitted through the FIS-B. This product uses HRRR model data, which currently provides a 1- and 2-hour forecast of the altitude of cloud tops and the cloud amounts. The FIS-B data source receives the cloud tops data from this model. The HRRR model data is updated hourly and the transmission interval occurs every 15 minutes.
This product is only currently available for the CONUS.
Localized Aviation Model Output Statistics (MOS) Program (LAMP)
The NWS has a long history of developing and using statistical analysis of historical and model weather data to produce forecast guidance for forecasters, which is known as MOS.
The LAMP system was developed to provide aviation forecast guidance. LAMP is designed to frequently update the central MOS product suite primarily by incorporating the most recent observational data. The guidance is available at over 2,000 stations in the CONUS, Alaska, Hawaii, and Puerto Rico. The products are updated hourly and valid over a 25-hour period.
The LAMP products are derived from a statistical model program that provides specific-point forecast guidance for select weather elements (e.g., precipitation, temperature, wind, visibility, ceiling height, sky cover). LAMP aviation weather products are provided in both graphical and coded text format, and are currently generated for more than 2,000 airports in the CONUS, Alaska, Hawaii, and Puerto Rico.
Alaska Aviation Guidance (AAG) Weather Product
The AAG is a completely automated product designed to provide a short-term projection of weather conditions at select locations based off the LAMP. The goal of this product is to provide additional aviation guidance to Alaska airports that have AWOS or ASOS observations, but do not have TAFs.
The AAG is a decoded plain language forecast valid for 6 hours and updated hourly.
Refer to the FAA’s Information for Operators (InFO) 20002, Use of the Experimental Alaskan Aviation Guidance (AAG) Weather Product (dated 3/25/20) for additional information and use of AAG.
AAG Example
Guidance for: PXXX (Someplace, AK) issued at 0900 UTC 12 Jun 2019
Forecast period: 0900 to 1000 UTC 12 June 2019
Forecast type: FROM: standard forecast or significant change
Winds: from the E (90 degrees) at 21 MPH (18 knots; 9.3 m/s) gusting to 28 MPH
(24 knots; 12.3 m/s)
Visibility: 2.00 sm (3.22 km)
Ceiling: 1500 feet AGL
Clouds: overcast cloud deck at 1500 feet AGL
Weather: -RA BR (light rain, mist)
Additional Products for Convection
This section will describe the following additional thunderstorm forecast products produced by the NWS that are of interest to aviation users:
- Convective Outlook, • TCF, and
- ECFP.
Note: The National Convective Weather Forecast (NCWF) was retired in 2018.
Convective Outlook (AC)
The NWS SPC issues narrative and graphical Convective Outlooks (AC) to provide the CONUS NWS WFOs, the public, the media, and emergency managers with the potential for severe (tornado, wind gusts 50 kt or greater, or hail with diameter 1 in or greater) and non-severe (general) convection and specific severe weather threats during the following 8 days. The Convective Outlook defines areas of marginal risk (MRGL), slight risk (SLGT), enhanced risk (ENH), moderate risk (MDT), or high risk (HIGH) of severe weather based on a percentage probability, which varies for time periods from 1 day to 3 days, and then two probabilistic thresholds for days 4 through 8. The day 1, day 2, and day 3 Convective Outlooks also depict areas of general thunderstorms (TSTM). The outlooks in graphical (see Figure 27-36) and text formats are available on the SPC’s website. See Figure 27-37 for the legend.

Figure Day 1 Categorical Convective Outlook Graphic Example
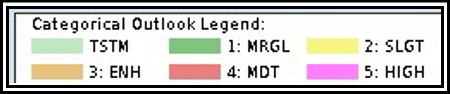
Figure Categorical Outlook Legend for Days 1-3 Convective Outlook Graphic Example
Traffic Flow Management (TFM) Convective Forecast (TCF)
The TCF is a high-confidence graphical representation of forecasted convection meeting specific criteria of coverage, intensity, and echo top height. The TCF graphics are produced every 2 hours and are valid at 4, 6, and 8 hours after issuance time.
Areas of convection in the TCF include any area of convective cells meeting the following criteria (at a minimum):
- Composite radar reflectivity of at least 40 dBZ;
- Echo tops at or above FL250;
- Coverage (criteria 1 and 2) of at least 25 percent of the polygon area; and
- Forecaster confidence of at least 50 percent (high) that criteria 1, 2, and 3 will be met.
Lines of convection in the TCF include any lines of convective cells meeting the following criteria (at a minimum):
- Composite radar reflectivity of at least 40 dBZ having a length of at least 100 NM;
- Linear coverage of 75 percent or greater;
- Echo tops at or above FL250; and
- Forecaster confidence of at least 50 percent (high) that criteria 1, 2, and 3 will be met.
All four of the threshold criteria listed above for both areas and lines of convection are necessary for inclusion in the TCF. This is defined as the minimum TCF criteria. The TCF does not include a forecast for all convection. If the convection does not meet the threshold criteria, it is not included in the TCF.
The TCF domain is the FIR covering the CONUS and adjacent coastal waters. It also includes the Canadian airspace south of a line from Thunder Bay, Ontario, to Quebec City, Quebec.
From March 1 through October 31, the TCF is collaboratively produced by meteorologists at the AWC in Kansas City, MO, and embedded at the FAA ATCSCC in Warrenton, VA; at the CWSU embedded at the FAA’s ARTCC; at various airlines; and by other authorized participants. Automated routines will continue to make the TCF available from November 1 through February 28.
The TCF is issued 24 hours a day, 7 days a week at 30 minutes prior to the indicated issuance time. The issuance time supports the FAA’s Strategic Planning Webinar, which occurs 15 minutes following odd hours Eastern Time. The Canadian portion of the forecast is available from April 1 through September 30. However, NAV CANADA may request the issuance of each forecast as early as March 1 and as late as October 31. All available Canadian forecasts are incorporated into the TCF. During times the forecasts are not available for Canadian airspace, the TCF graphics will be annotated with “No Canadian TCF.” The graphical representation is subject to annual revision.
The AWC also produces an Extended TCF that provides TCFs from 10 to 30 hours at 2-hour increments.
The TCF and Extended TCF is used by air traffic management decisionmakers in support of convective weather mitigation strategies within the NAS. It is designed to meet the needs of TFM decisionmakers at the FAA’s ATCSCC, the FAA’s ARTCC TMUs, and airline and corporate flight operations centers (FOC).
Figure 27-38 shows an example of a TCF.
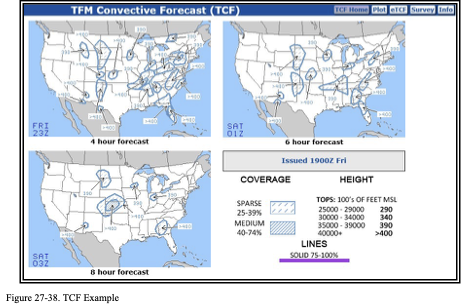
Extended Convective Forecast Product (ECFP)
The ECFP planning tool (see Figure 27-39) is a graphical representation of the forecast probability of thunderstorms and is intended to support the long-range planning for convective constraints in the NAS. The product identifies graphically where thunderstorms are expected through the next 72 hours over the CONUS. Although the ECFP uses TCF-style graphics to facilitate ease of interpretation, the ECFP does not forecast TCF criteria.
The development of the ECFP planning tool was a response to FAA and industry needs in planning for weather hazards, specifically convection, 1 to 3 days in advance. To meet these planning needs, the ECFP provides traffic planners and collaborators a quick look at where the probability of convection is greatest. By utilizing TCF-style graphics, users familiar with the TCF can easily determine where traffic constraints are most likely to occur over the next 3 days.
The ECFP is an automated forecast product issued by the AWC. It is issued four times a day at approximately 0100, 0700, 1300, and 1900 UTC.
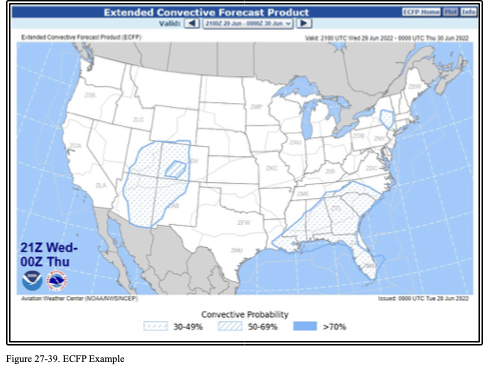
Watch Notification Messages
The NWS SPC issues severe weather Watch Notification Messages to provide an area threat alert for the aviation meteorology community to forecast organized severe thunderstorms that may produce tornadoes, large hail, and/or convective damaging winds within the CONUS.
The SPC issues three types of Watch Notification Messages:
- Aviation Watch Notification Message (SAW),
- Public Severe Thunderstorm Watch Notification Message, and
- Public Tornado Watch Notification Message.
The SAW was formerly known as the Alert Severe Weather Watch Bulletin (AWW), as well as the Severe Weather Forecast Alert. The NWS no longer uses these titles or acronym for this product. The NWS uses the acronym SAW for the Aviation Watch Notification Message, but retains “AWW” in the product header for processing by weather data systems. The NWS uses the acronym AWW for their Airport Weather Warning product, which is a completely different product from the SAW
The Severe Thunderstorm and Tornado Watch Notification Messages were formerly known as the Severe Weather Watch Bulletins (WW). The NWS no longer uses that title or acronym for this product but retains “WW” in the product header for processing by weather data systems.
It is important to note the difference between a Severe Thunderstorm (or Tornado) Watch and a Severe Thunderstorm (or Tornado) Warning. A “watch” means severe weather is possible during the watch valid time, while a “warning” means that severe weather has been observed or is expected within the hour. Only the SPC issues Severe Thunderstorm and Tornado Watches, while only NWS WFOs issue Severe Thunderstorm and Tornado Warnings.
Aviation Watch Notification Message (SAW)
The SPC issues the SAW to provide an area threat alert for the aviation meteorology community to forecast organized severe thunderstorms that may produce tornadoes, large hail, and/or convective damaging winds as indicated in Public Watch Notification Messages.
The SAW product is an approximation of the area in a watch. For the official area covered by a watch, see the corresponding Public Watch product. To illustrate, Figure 27-40 is an example of the Aviation Watch (polygon) compared to the Public Watch (shaded). Also, the SAW is easier to communicate verbally over the radio and telephone than reciting the entire Public Watch product.
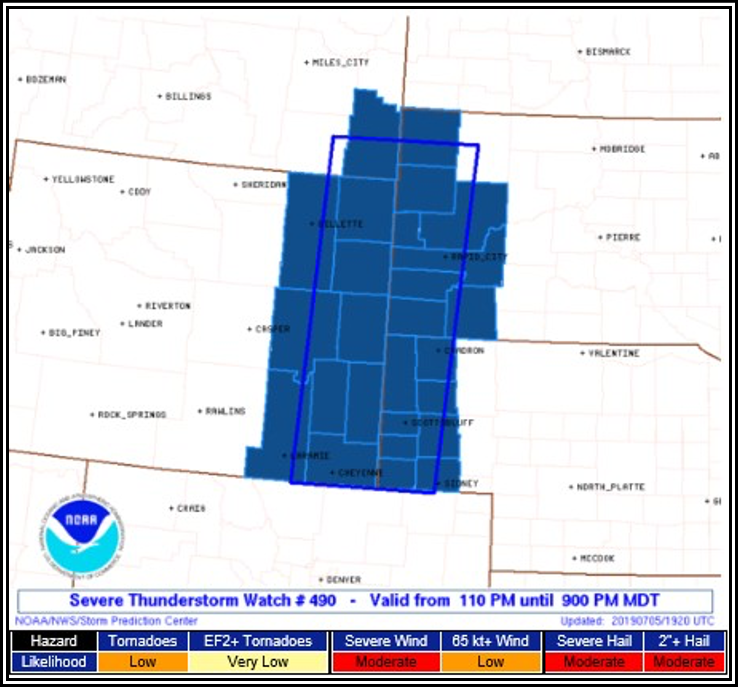
Figure Aviation Watch (polygon) Compared to Public Watch (shaded) Example
The SPC will issue the SAW after the proposed convective watch area has been collaborated with the impacted NWS WFOs defining the approximate areal outline of the watch.
SAWs are nonscheduled, event-driven products valid from the time of issuance to expiration or cancellation time. Valid times are in UTC. SPC will correct watches for formatting and grammatical errors.
When tornadoes or severe thunderstorms have developed, the local NWS WFO will issue the warnings for the storms.
Format and Example of a SAW
SPC forecasters may define the area as a rectangle or parallelogram (X miles either side of the line from point A to point B, or X miles north and south or east and west of the line from point A to point B). Distances of the axis coordinates should be in statute miles. The aviation coordinates referencing VOR locations and state distances will be in nautical miles. Valid times will be in UTC. The watch half width will be in statute miles. The SAW will contain hail size in inches or half inches (forecaster discretion for tornado watches associated with hurricanes) surface and aloft, surface convective wind gusts in knots, maximum cloud tops and the Mean Storm Motion Vector, and replacement information, if necessary.
WWUS30 KWNS 271559
SAW2
SPC AWW 271559
WW 568 TORNADO AR LA MS 271605Z – 280000Z AXIS..65 STATUTE MILES EAST AND WEST OF LINE..
45ESE HEZ/NATCHEZ MS/ – 50N TUP/TUPELO MS/
..AVIATION COORDS.. 55NM E/W /18WNW MCB – 60E MEM/
HAIL SURFACE AND ALOFT..3 INCHES. WIND GUSTS..70 KNOTS. MAX TOPS TO 550. MEAN STORM MOTION VECTOR 26030.
LAT…LON 31369169 34998991 34998762 31368948
THIS IS AN APPROXIMATION TO THE WATCH AREA. FOR A COMPLETE DEPICTION OF THE WATCH SEE WOUS64 KWNS FOR WOU2.
Table 27-15. Decoding an Aviation Weather Watch Notification Message
| Line(s) | Content | Description |
| 1 | WWUS30 KWNS 271559 | Communication header with issuance date/time |
| 2 | SAW2 | NWS product type (SAW) and issuance number (2) |
| 3 | SPC AWW 271559 | Issuing office Product type Issuance date/time |
| 4 | WW 568 TORNADO AR LA MS 271605Z – 280000Z | Watch number Watch type States affected Valid date/time period |
| 5 | AXIS..65 STATUTE MILES EAST AND WEST OF A LINE… | Watch axis |
| 6 | 45ESE HEZ/NATCHEZ MS/ – 50N TUP/TUPELO MS/ | Anchor points |
| 7 | …AVIATION COORDS..55NM E/W /18WNW MCB – 60E MEM/ | Aviation coordinates |
| 8–9 | HAIL SURFACE AND ALOFT…3 INCHES. WIND GUSTS..70 KNOTS. MAX TOPS TO 550. MEAN STORM MOTION VECTOR 26030. | Type, intensity, max tops and mean storm motion using standard contractions. |
| 10 | (blank line) | |
| 11 | LAT…LON 31369169 34998991 4998762 31368948 | Latitude and longitude coordinates |
| 12 | (blank line) | |
| 13–15 | THIS IS AN APPROXIMATION TO THE WATCH AREA. FOR A COMPLETE DEPICTION OF THE WATCH SEE WOUS64 KWNS FOR WOU2. | Notice that this is an approximation of the watch area and for users to refer to the referenced product for the actual area |
Public Severe Thunderstorm Watch Notification Message
The SPC issues a Public Severe Thunderstorm Watch Notification Message when forecasting six or more hail events of 1 in (quarter-sized) diameter or greater or damaging winds of 50 kt (58 mph) or greater. The forecast event minimum threshold is at least 2 hours over an area of at least 8,000 mi2. Below these thresholds, the SPC, in collaboration with affected NWS offices, may issue a watch for smaller areas and for shorter periods of time when conditions warrant, and for convective watches along coastlines, near the Canadian border, and near the Mexican border.
A Public Severe Thunderstorm Watch Notification Message contains three bulleted blocks of information:
- The geographic area of the watch,
- The valid time of the watch, and
- A description of the primary threats anticipated within the watch.
A plain text watch summary is included beneath the bulleted information followed by a more detailed description of the area and axis of the watch.
The SPC includes the term “adjacent coastal waters” when the watch affects coastal waters adjacent to the Pacific/Atlantic coast, the Gulf of Mexico, or the Great Lakes. Adjacent coastal waters refers to a WFO’s near-shore responsibility (out to 20 NM for oceans), except for convective watches.
The SPC issues a watch cancellation message when no counties, parishes, independent cities, and/or marine zones remaining are in the watch area prior to the expiration time. The text of the message will specify the number and area of the cancelled watch.
Public Tornado Watch Notification Message
The SPC issues a Public Tornado Watch Notification Message when forecasting two or more tornadoes or any tornado that could produce EF-2 or greater damage. The forecast event minimum thresholds are at least 2 hours over an area at least 8,000 mi2. Below these thresholds, the SPC, in collaboration with affected NWS offices, may issue a watch for smaller areas and for shorter periods of time when conditions warrant, and for convective watches along coastlines, near the Canadian border, and near the Mexican border.
A Public Tornado Watch Notification Message contains the following:
- The area description and axis,
- The watch expiration time,
- The term “damaging tornadoes,”
- A description of the largest hail size and strongest thunderstorm wind gusts expected,
- The definition of the watch,
- A call-to-action statement,
- A list of other valid watches,
- A brief discussion of meteorological reasoning, and
- Technical information for the aviation community.
The SPC may enhance a Public Tornado Watch Notification Message by using the words “THIS IS A PARTICULARLY DANGEROUS SITUATION” when there is a likelihood of multiple strong (damage of EF-2 or EF-3) or violent (damage of EF-4 or EF-5) tornadoes.
The SPC includes the term “adjacent coastal waters” when the watch affects coastal waters adjacent to the Pacific/Atlantic coast or the Gulf of Mexico. Adjacent coastal waters refers to a WFO’s near-shore responsibility (out to 20 NM for oceans), which includes portions of the Great Lakes.
The SPC issues a watch cancellation message whenever it cancels a watch prior to the expiration time. The text of the message will specify the number and area of the cancelled watch.
Route Forecast (ROFOR)
The ROFOR product is no longer issued by the NWS and has been replaced by the GFA in the Pacific. See Section 28.2 for information on the GFA.
Aviation Forecast Discussion (AFD)
AFDs describe the weather conditions within a multistate or substate-sized area. They also may:
- Describe the weather conditions as they relate to a specific TAF or group of TAFs; and
- Provide additional aviation weather-related issues that cannot be encoded into the TAF, such as the reasoning behind the forecast.
AFDs are a free-form plain language text product. Common or well-known aviation weather contractions are used as well as local or regional geographic names, such as valleys, mountain ranges, and bodies of water.
Technically, the AFD is not a discrete product; it is the aviation section in the NWS WFO’s AFD. The NWS AWC extracts the aviation section from the WFO’s AFD and makes it available on the AWC’s website under the Forecasts tab, titled “Avn. Forecast Disc.” The aviation section of the AFD can also be found on the WFO’s website under “Forecaster Discussion.”
All WFOs in the CONUS, and most outside the CONUS, produce the aviation section of the AFD for their area of responsibility (see Figure 27-41). They are issued roughly every 6 hours and correspond to the issuance of TAFs from the respective NWS WFO. Each NWS office may tailor the format to meet the needs of their local aviation users.
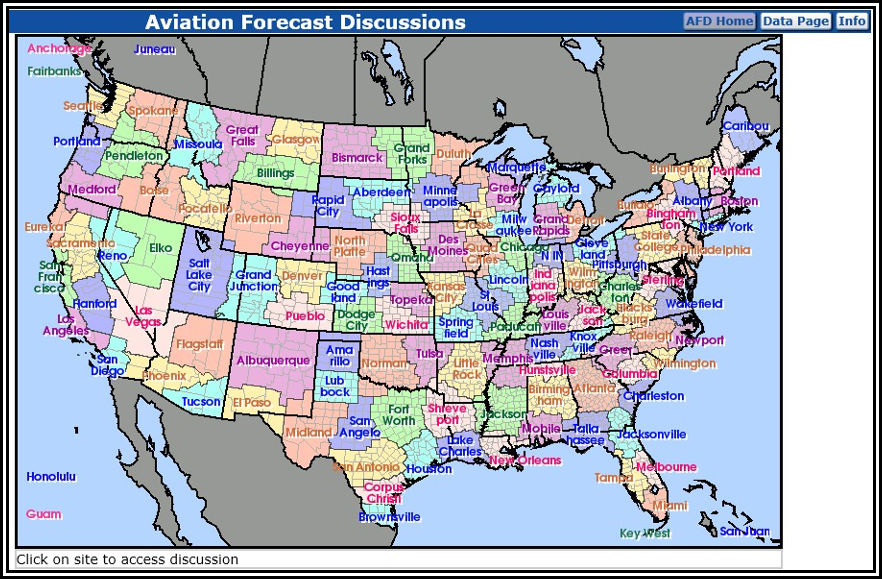
Figure Map of NWS WFO’s Area of Responsibility
Example
NWS Boise, ID
COLD FRONT CURRENTLY OVER SW IDAHO WEST OF THE MAGIC VALLEY. IFR IN HEAVIER RAIN/SNOW SHOWERS BEHIND THE FRONT MOSTLY IN THE MTNS UNTIL THIS EVENING. OTHERWISE LOW VFR THROUGH TOMORROW WITH ISOLATED SHOWERS INTO THE EVENING. SURFACE WINDS…W TO NW WITH GUSTS 20-30 KTS…BECOMING 35-45 KTS IN THE UPPER TREASURE AND MAGIC VALLEYS FOR A FEW HOURS THIS AFTERNOON…DROPPING DOWN TO 20-30 KTS OVERNIGHT INTO THE MORNING IN THE MAGIC VALLEY AND 5-10 KTS ELSEWHERE. WINDS ALOFT NEAR 10K FT MSL…NW 30-40 KTS…40-50 KTS OVER THE UPPER TREASURE AND MAGIC VALLEYS OVERNIGHT…BECOMING 20-30 KTS BY 15/12Z.
Meteorological Impact Statement (MIS)
The MIS is a nontechnical plain language product intended primarily for FAA traffic managers and those involved in planning aircraft routing. MISs are issued by the NWS CWSU.
MISs are available on the AWC’s website as well as CWSU’s websites.
The MIS valid times are determined according to local policy. The MIS is limited to a 48-hour valid period.
Example
ZAB MIS 02 VALID 281300-290300 …FOR ATC PLANNING PURPOSES ONLY…
AN UPPER-LVL DISTURBANCE OVER COLORADO COMBINED WITH A STRONG JET STREAM MOVING ACROSS THE SWRN U.S. IS FCST TO PRODUCE AREAS OF TURBULENCE ACROSS PORTIONS OF ZAB. THE TURBULENCE IS FCST TO SUBSIDE AFT 00Z AS THE DISTURBANCE AND JETSTREAM MOVE FURTHER EAST.
Soaring Forecast
Select NWS WFOs issue soaring forecasts. These are automated forecasts primarily derived from the radiosonde observation or model-generated soundings.
The content and format of soaring forecasts vary with the NWS WFO providing the forecast, based on the needs of their soaring community. It is beyond the scope of this handbook to describe all of the many variations of soaring forecasts and their content. Soaring pilots should consult with the NWS WFO in their soaring area for more information.
Example
The following example is for Salt Lake City, Utah:
UXUS97 KSLC 091233 SRGSLC
Soaring Forecast
National Weather Service Salt Lake City, Utah
0633 MDT Tuesday, July 9, 2019
This forecast is for Tuesday, July 9, 2019:
If the trigger temperature of 81.4 F/27.4 C is reached…then
Thermal Soaring Index………………….. Excellent
Maximum rate of lift…………………… 1239 ft/min (6.3 m/s)
Maximum height of thermals……………… 17411 ft MSL (13185 ft AGL) Forecast maximum temperature………………. 88.0 F/31.6 C
Time of trigger temperature……………….. 1200 MDT
Time of overdevelopment…………………… None
Middle/high clouds during soaring window……. None
Surface winds during soaring window………… 20 mph or less
Height of the -3 thermal index…………….. 10097 ft MSL (5872 ft AGL)
Thermal soaring outlook for Wednesday 07/10…. Excellent Wave Soaring Index……………………….. Not available Remarks…
Sunrise/Sunset……………….. 06:05:02 / 21:01:07 MDT
Total possible sunshine……….. 14 hr 56 min 5 sec (896 min 5 sec) Altitude of sun at 13:33:04 MDT… 70.27 degrees
Upper air data from rawinsonde observation taken on 07/09/2019 at 0600 MDT
Freezing level……………… 13975 ft MSL (9749 ft AGL)
Convective condensation level… 15400 ft MSL (11174 ft AGL)
Lifted condensation level……. 16064 ft MSL (11838 ft AGL)
Lifted index……………….. -0.7
K index……………………. +19.1
This product is issued once per day by approximately 0600 MST/0700 MDT (1300 UTC). This product is not continuously monitored nor updated after the initial issuance.
The information contained herein is based on the 1200 UTC rawinsonde observation at the Salt Lake City, Utah International Airport and/or numerical weather prediction model data representative of the airport. These data may not be representative of other areas along the Wasatch Front. Erroneous data such as these should not be used.
The content and format of this report as well as the issuance times are subject to change without prior notice.
Balloon Forecast
Select NWS WFOs issue balloon forecasts. These are automated forecasts primarily derived from the radiosonde observation or model-generated soundings.
The content and format of balloon forecasts vary with the NWS WFO providing the forecast, based on the needs of their ballooning community. It is beyond the scope of this handbook to describe all of the many variations of balloon forecasts and their content. Balloon pilots should consult with the NWS WFO in their area for more information.
Example
The following example is for St. Louis, Missouri:
SXUS43 KLSX 090850
RECSTL
Morning Hot Air Balloon Forecast
National Weather Service Saint Louis MO
350 AM CDT Tue Jul 9 2019
…HERE IS THE MORNING HOT AIR BALLOON FORECAST FOR THE SAINT LOUIS METROPOLITAN AREA…
| .THIS MORNING… | |
| Sunrise: | 545 AM. |
| Surface Wind Forecast: | 6 AM…110/05 mph. |
| 8 AM…120/05 mph. | |
| Latest Geostrophic Wind: | 1 AM…160/15 mph. |
| Boundary Layer Wind: | 7 AM…120/06 mph. |
| 10 AM…160/12 mph. |
NWS Doppler Winds (at 0334 AM): 1000ft…130/15 mph.
| 2000ft…150/22 mph. | |
| 3000ft…160/20 mph. | |
| Surface Lifted Index: | 7 AM…+3. |
| 10 AM…-1. | |
| Density Altitude: | 6 AM…1708 FT. |
| 8 AM…1948 FT. | |
| Additional Weather Info: .OUTLOOK FOR THIS EVENING… Sunset: 829 PM. | Slight chance of thunderstorms. |
| Weather: Chance of thunderstorms. Surface Wind: 6 PM…150/07 mph. 8 PM…150/06 mph. Boundary Wind: 4 PM…160/14 mph. 7 PM…160/08 mph. | |
This forecast is not routinely updated or amended outside of scheduled issuances.
&&
This forecast is also available at phone number 636-441-8467 ext 5.
$$
TES


