Introduction
The first of five types of aviation weather information discussed in this handbook is observations. Observations are weather data collected automatically by sensor(s), manually by trained weather observers, or by a combination of both, and are the basic information upon which forecasts and advisories are made in support of a wide range of weather-sensitive activities within the public and private sectors, including aviation.
For this handbook, observations include the following:
- Surface observations,
- Trained weather observers,
- Aircraft observations,
- Radar observations,
- Satellite observations,
- Upper air observations (e.g., weather balloon),
- Aviation weather cameras
Surface Observations
Surface weather observations are fundamental to all meteorological services. Observations are the basic information upon which forecasts and warnings are made in support of a wide range of weather-sensitive activities within the public and private sectors, including aviation.
There are three general types of surface weather observations:
- Manual, •
- Automated, and Augmented.
Manual Observation
Manual surface weather observations are made by a human weather observer who is certified by the FAA. While manual observations were the primary type prior to the mid-1990s, automated and augmented observations make up the vast majority of today’s surface observations in the United States.
Automated Observation
Automated observations are derived from instruments and algorithms without human input or oversight. In the United States, there are two main kinds of automated observing systems: ASOS and AWOS. Automated observations contain “AUTO” in the report unless they are augmented by a human weather observer.
Augmented Observation
At select airports in the United States, the automated observing system will have input and oversight by human weather observers or tower controllers certified in weather observing. These are referred to as augmented observations. Human observers report weather elements that are beyond the capabilities of the automated system and/or are deemed operationally significant. The weather elements observed and reported by the human observer vary, depending on the airport. “AUTO” is not used in augmented reports.
Recency of Observed Elements at Automated Stations
For those elements that the human observer evaluates using spatial averaging techniques (e.g., sky cover and visibility), the automated station substitutes time averaging of sensor data. Therefore, in an automated observation, sky condition is an evaluation of sensor data gathered during the 30-minute period ending at the actual time of the observation. All other elements are based on sensor data that is within 10 minutes or less of the actual time of the observation.
Automated Surface Observing System (ASOS) and Automated Weather Observing System (AWOS)
Automated Surface Observing System (ASOS)
The ASOS program is a joint effort of the NWS, the FAA, and the DOD. ASOS serves as the nation’s primary surface weather observing network.
ASOS detects significant changes, disseminating hourly and special observations. Additionally, ASOS routinely and automatically provides computer-generated voice observations directly to aircraft in the vicinity of airports, using FAA ground-to-air radio. These messages are also available via a telephone. ASOS observes, formats, archives, and transmits observations automatically. ASOS transmits a special report when conditions exceed preselected weather element thresholds (e.g., the visibility decreases to less than 3 mi).
All ASOS locations prepare and disseminate METARs/SPECIs in accordance with the format shown in Section 24.4.3.
ASOS One-Minute Observations (OMO)
In addition to the ASOS METARs/SPECIs are ASOS OMOs, which are updated once a minute. OMOs can be in various formats and are sometimes encoded in the METAR format.
ASOS broadcasts can be different from the METAR seen on the internet or FIS-B, since the broadcast is the OMO ASOS data.
The OMOs are not “instant weather;” rather, the clouds and visibility are time averaged (30 minutes for clouds, 10 minutes for visibility). The averaging algorithms are designed to report deteriorating conditions much quicker than improving conditions.
ASOS Reporting
ASOS reports the following basic weather elements:
- Sky condition: cloud height and amount (e.g., clear, few, scattered, broken, overcast) up to 12,000 ft (future upgrade may raise height limit).
- Visibility (to at least 10 sm).
- Basic present weather information: type and intensity for rain (RA), snow (SN), freezing rain (FZRA), and unknown precipitation (UP).
- Thunderstorms on site (TS) or in the vicinity (VCTS).
- Obstructions to vision: fog (FG), mist (BR), and haze (HZ).
Note: FG is reported when visibility is less than 5/8 sm. Freezing fog (FZFG) is reported when temperature is below 0 ºC. BR or HZ is reported for visibilities from 5/8 sm to less than 7 sm, depending on the difference between the temperature and dewpoint. If the difference is 4 ºF (about 2 ºC) or less, then FG is reported; otherwise, HZ is reported.
- Pressure: sea level pressure and altimeter setting.
- Temperature: ambient temperature and dewpoint temperature.
- Wind: direction from which the wind is blowing, speed, and character (e.g., gusts, squalls).
Note: National network distribution (e.g., FSS, internet, and FIS-B) of wind direction is in true degrees, while local dissemination (e.g., radio and telephone) is in magnetic degrees.
- Precipitation: accumulation.
- Selected significant remarks, including: variable cloud height, variable visibility, precipitation beginning/ending times, rapid pressure changes, pressure change tendency, wind shift, and peak wind, and may include density altitude.
Automated Weather Observing System (AWOS)
AWOS is a system similar to ASOS. Generally, AWOS does not report all the elements as ASOS and may not have the same level of backup sensors or maintenance response levels. Regardless, AWOS provides pilots with the necessary weather information to conduct 14 CFR part 91 flight operations as well as others, depending on their operations specifications (OpSpecs).
AWOS automatically provides computer-generated voice observations directly to aircraft in the vicinity of airports, using FAA ground-to-air radio. AWOS reports are also available via a telephone.
AWOS may be located on airports, at or near ground-based or rooftop-based heliports, as well as on offshore platforms and drill ships.
AWOS are either Federal or non-Federal. Federal AWOS units are owned, operated, and maintained by the FAA. Non-Federal AWOS are owned, operated, and maintained by the site owner.
AWOS generates a METAR at 20-minute intervals and does not report SPECIs. AWOS also provides OMOs available by phone or radio.
The OMOs are not “instant weather;” rather, the clouds and visibility are time averaged (30 minutes for clouds, 10 minutes for visibility). The averaging algorithms are designed to report deteriorating conditions much quicker than improving conditions. For example, if dense fog had been reported and then suddenly dissipated, it might take up to 10 minutes for the OMOs to report VFR conditions.
There are six types of AWOS systems:
- AWOS-A: The AWOS-A system measures and reports altimeter only.
- AWOS-AV: The AWOS-AV consists of an AWOS-A with a visibility sensor.
- AWOS-1: The AWOS-1 system measures and reports wind data (e.g., speed, direction, and gusts; temperature; dewpoint; altimeter; and density altitude).
- AWOS-2: The AWOS-2 system measures and reports all of the parameters of an AWOS-1 system plus visibility.
- AWOS-3: The AWOS-3 system measures and reports all of the parameters of an AWOS-2 system plus precipitation accumulation (rain gauge) and cloud height. AWOS-3 can have optional sensors such as precipitation type/intensity (present weather, P) and/or thunderstorm/lightning (T). The addition of an optional sensors will change the designation to AWOS-3P or AWOS-3PT.
- AWOS-4: The AWOS-4 system measures and reports all of the AWOS-3PT parameters plus freezing rain.
Depending on the type of AWOS unit, the following parameters may be measured:
- Altimeter.
- Wind speed.
- Wind direction (from which the wind is blowing).
Note: National network distribution (e.g., FSS, internet, and FIS-B) of wind direction is in true degrees, while local dissemination (e.g., radio and telephone) is in magnetic degrees.
- Gusts.
- Temperature.
- Dewpoint.
- Density altitude.
- Visibility.
- Precipitation accumulation.
- Cloud height.
- Precipitation type.
- Precipitation intensity.
- Present weather.
- Thunderstorm/lightning.
- Freezing rain.
- Runway surface condition.
Aviation Routine Weather Report (METAR) and Aviation Selected Special Weather Report (SPECI)
The METAR and SPECI are the code form used for aviation surface observations (reports) to satisfy World Meteorological Organization (WMO) and ICAO instructions for reporting surface meteorological data. Although the METAR and SPECI code is used worldwide, there are some code differences among countries. Each country is allowed to make modifications to the code for use in their particular country, as long as they notify ICAO. These sections will focus on the METAR/SPECI code as used in the United States.
Traditionally, it was critical for pilots to know how to decode the METAR and SPECI. The majority of current preflight briefing services, including many weather applications, provide the decoded report in a plain language format in addition to the coded report. Table 24-1 provides an example of a decoded METAR. While the decoded version has been welcomed by many pilots, it is still important for all pilots to know how to decode the METAR/SPECI in case the source does not provide a decoded version.
Table 24-1. An Example of a Decoded METAR for an Aviation Weather Website

Aviation Routine Weather Report (METAR)
A METAR includes the airport identifier, time of observation, wind, visibility, Runway Visual Range (RVR), present weather phenomena, sky conditions, temperature, dewpoint, and altimeter setting. Excluding the airport identifier and the time of observation, this information is collectively referred to as the “body” of the report. Coded and/or plain language information elaborating on data in the body may be appended to the end of the METAR as “remarks.” The contents of the remarks section vary with manual, automated, and augmented surface observations. At some designated stations, the METAR may be abridged to include only a few of the mentioned elements. METARs are sometimes referred to as “hourly” reports since they are routinely produced near the top of the hour.
Aviation Selected Special Weather Report (SPECI)
A SPECI is an unscheduled report taken when any of the criteria given in Table 24-2 are observed during the period between hourly reports. SPECIs contain all data elements found in a METAR. All SPECIs are issued as soon as possible when relevant criteria are observed.
Whenever SPECI criteria are met at the time of the routine METAR, a METAR is issued. Table 24-2. SPECI Criteria
| 1 | Wind Shift | Wind direction changes by 45° or more, in less than 15 minutes, and the wind speed is 10 knots or more throughout the wind shift. |
| 2 | Visibility | Visibility as reported in the body of the report decreases to less than, or if below, increases to equal or exceed: 3miles. 2 miles. 1 mile. ½ mile. ¼ mile. The lowest standard IAP minimum as published in the U.S. Terminal Procedures, if not listed above. |
| 3 | RVR | The highest value from the designated RVR runway decreases to less than 2,400 ft during the preceding 10 minutes; or, if the RVR is below 2,400 ft, increases to equal to or exceed 2,400 ft during the preceding 10 minutes. U.S. military stations may not report a SPECI based on RVR. |
| 4 | Tornado, Funnel Cloud, or Waterspout | Is observed. Disappears from sight, or ends. |
| 5 | Thunderstorm | Begins (a SPECI is not required to report the beginning of a new thunderstorm if one is currently reported). Ends. |
| 6 | Precipitation | Hail begins or ends. Freezing precipitation begins, ends, or changes intensity. Ice pellets begin, end, or change intensity. Snow begins, ends, or changes intensity. |
| 7 | Squalls | When a squall occurs. |
| 8 | Ceiling | The ceiling changes1 through: 3,000 ft. 1,500 ft. 1,000 ft. 500 ft. The lowest standard IAP minimum.2 “Ceiling change” means that it forms, dissipates below, decreases to less than, or, if below, increases to equal or exceed the values listed. As published in the U.S. Terminal Procedures. If none published, use 200 ft. |
| 9 | Sky Condition | A layer of clouds or obscurations aloft is present below 1,000 ft and no layer aloft was reported below 1,000 ft in the preceding METAR or SPECI. |
| 10 | Volcanic Eruption | When an eruption is first noted. |
| 11 | Aircraft Mishap | Upon notification of an aircraft mishap,1 unless there has been an intervening observation. 1 “Aircraft mishap” is an inclusive term to denote the occurrence of an aircraft accident or incident. |
| 12 | Miscellaneous | Any other meteorological situation designated by the responsible agency of which, in the opinion of the observer, is critical. |
METAR/SPECI Format
A U.S. METAR/SPECI has two major sections: the body (consisting of a maximum of 11 groups) and the remarks (consisting of 2 categories). When an element does not occur, or cannot be observed, the corresponding group is omitted from that particular report.
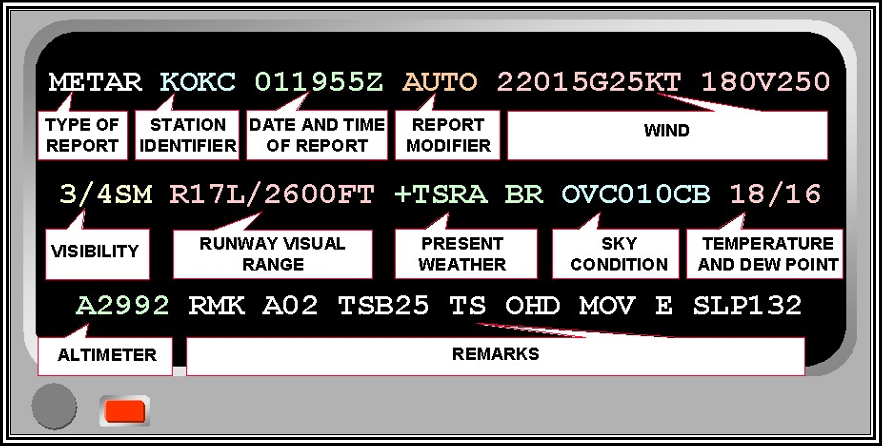
Figure . METAR/SPECI Coding Format
Type of Report
METAR KOKC 011955Z AUTO 22015G25KT 180V250 3/4SM R17L/2600FT +TSRA BR OVC010CB 18/16 A2992 RMK AO2 TSB25 TS OHD MOV E SLP132
The type of report, METAR or SPECI, precedes the body of all reports, but may not be shown or displayed on all aviation weather websites.
Station Identifier
METAR KOKC 011955Z AUTO 22015G25KT 180V250 3/4SM R17L/2600FT +TSRA BR OVC010CB 18/16 A2992 RMK AO2 TSB25 TS OHD MOV E SLP132
The station identifier, in ICAO format, is included in all reports to identify the station to which the coded report applies.
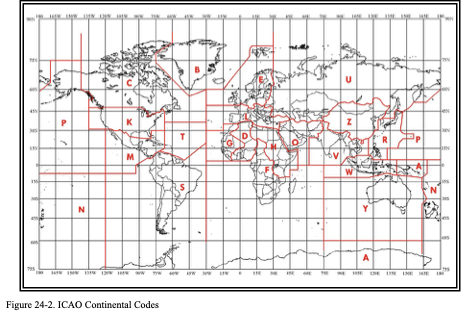
The ICAO airport code is a four-letter alphanumeric code designating each airport around the world. The ICAO codes are used for flight planning by pilots and airline operation departments. These codes are not the same as the International Air Transport Association (IATA) codes encountered by the general public used for reservations, baggage handling, and in airline timetables.
Unlike the IATA codes, the ICAO codes have a regional structure. The first letter identifies the region and country (see Figure 24-2). In some regions, the second letter identifies the country. ICAO station identifiers in Alaska begin with “PA,” Hawaii begins with “PH,” Guam begins with “PG,” and Puerto Rico begins with “TS.” For example, the San Juan, Puerto Rico, IATA identifier “SJU” becomes the ICAO identifier “TSJU.” The remaining letters are used to identify each airport.
In the CONUS, ICAO station identifiers are coded K, followed by the three-letter IATA identifier. For example, the Seattle, WA, IATA identifier “SEA” becomes the ICAO identifier “KSEA.” ICAO station identifiers in Alaska, Hawaii, and Guam begin with the continent code P.
For a list of all U.S. identifiers, refer to FAA Order JO 7350.9, Location Identifiers. For a complete worldwide listing, refer to ICAO Doc 7910, Location Indicators. Both are available online.
Date and Time of Report
METAR KOKC 011955Z AUTO 22015G25KT 180V250 3/4SM R17L/2600FT +TSRA BR OVC010CB 18/16 A2992 RMK AO2 TSB25 TS OHD MOV E SLP132
The date and time are coded in all reports as follows: the day of the month is the first two digits (01), followed by the hour (19), and the minutes (55).
The coded time of observations is the actual time of the report, or when the criteria for a SPECI is met or noted.
If the report is a correction to a previously disseminated report, the time of the corrected report is the same time used in the report being corrected.
The date and time group always ends with a Z, indicating Zulu time (or Coordinated Universal Time (UTC)).
For example, METAR KOKC 011955Z would be disseminated as the 2,000-hour routine report for station KOKC, taken on the 1st of the month at 1955 UTC.
Report Modifier (as appropriate)
METAR KOKC 011955Z AUTO 22015G25KT 180V250 3/4SM R17L/2600FT +TSRA BR OVC010CB 18/16 A2992 RMK AO2 TSB25 TS OHD MOV E SLP132
The report modifier AUTO identifies the METAR/SPECI as a fully automated report with no human intervention or oversight. In the event of a corrected METAR or SPECI, the report modifier “COR” is substituted for “AUTO.”
Wind Group
METAR KOKC 011955Z AUTO 22015G25KT 180V250 3/4SM R17L/2600FT +TSRA BR OVC010CB 18/16 A2992 RMK AO2 TSB25 TS OHD MOV E SLP132
Wind is the horizontal motion of air past a given point. It is measured in terms of velocity, which is a vector that includes direction and speed. It indicates the direction the wind is coming from.
In the wind group, the wind direction is coded as the first three digits (220) and is determined by averaging the recorded wind direction over a 2-minute period. It is coded in tens of degrees relative to true north using three figures. Directions less than 100° are preceded with a 0. For example, a wind direction of 90° is coded as 090. A wind from the north is coded as 360.
Immediately following the wind direction is the wind speed coded in two or three digits (15). Wind speed is determined by averaging the speed over a 2-minute period and is coded in whole knots using the units, tens digits, and, when appropriate, the hundreds digit. When wind speeds are less than 10 kt, a leading 0 is used to maintain at least a two-digit wind code. For example, a wind speed of 8 kt will be coded 08KT. The wind group is always coded with a KT to indicate wind speeds are reported in knots. Other countries may use km/h or meters per second (m/s) instead of knots.
Examples:
| 05008KT | Wind 50° at 8 kt |
| 15014KT | Wind 150° at 14 kt |
| 340112KT | Wind 340° at 112 kt |
Wind Gust
Wind speed data for the most recent 10 minutes is examined to evaluate the occurrence of gusts. Gusts are defined as rapid fluctuations in wind speed with a variation of 10 kt or more between peaks and lulls. The coded speed of the gust is the maximum instantaneous wind speed.
Wind gusts are coded in two or three digits immediately following the wind speed. Wind gusts are coded in whole knots using the units, tens, and, when appropriate, the hundreds digit. For example, a wind out of the west at 20 kt with gusts to 35 kt would be coded 27020G35KT.
Variable Wind Direction (speed 6 kt or less)
Wind direction may be considered variable when, during the previous 2-minute evaluation period, the wind speed was 6 kt or less. In this case, the wind may be coded as VRB in place of the three-digit wind direction. For example, if the wind speed was recorded as 3 kt, it would be coded VRB03KT.
Variable Wind Direction (speed greater than 6 kt)
Wind direction may also be considered variable when, during the 2-minute evaluation period, it varies by 60° or more and the speed is greater than 6 kt. In this case, a variable wind direction group immediately follows the wind group. The directional variability is coded in a clockwise direction and consists of the extremes of the wind directions separated by a V. For example, if the wind is variable from 180 to 240° at 10 kt, it would be coded 21010KT 180V240.
Calm Wind
When no motion of air is detected, the wind is reported as calm. A calm wind is coded as 00000KT.
Visibility Group
METAR KOKC 011955Z AUTO 22015G25KT 180V250 3/4SM R17L/2600FT +TSRA BR OVC010CB 18/16 A2992 RMK AO2 TSB25 TS OHD MOV E SLP132
Visibility is a measure of the opacity of the atmosphere. It is defined as the greatest horizontal distance at which selected objects can be seen and identified, or its equivalent derived from instrumental measurements.
Prevailing visibility is the reported visibility considered representative of recorded visibility conditions at the manual station during the time of observation. It is the greatest distance that can be seen throughout at least half of the horizon circle, not necessarily continuous.
Surface visibility is the prevailing visibility from the surface at manual stations or the visibility derived from sensors at automated stations.
The visibility group is coded as the surface visibility in statute miles. A space is coded between whole numbers and fractions of reportable visibility values. The visibility group ends with SM to indicate that the visibility is in statute miles. For example, a visibility of 1½ sm is coded 1 1/2SM. Most other countries use meters.
U.S. automated stations use an M to indicate “less than.” For example, M1/4SM means a visibility of less than ¼ sm.
Runway Visual Range (RVR) Group
METAR KOKC 011955Z AUTO 22015G25KT 180V250 3/4SM R17L/2600FT +TSRA BR OVC010CB 18/16 A2992 RMK AO2 TSB25 TS OHD MOV E SLP132
The RVR is an instrument-derived value representing the horizontal distance a pilot may see down the runway.
RVR is reported whenever the station has RVR equipment and prevailing visibility is 1 sm or less, and/or the RVR for the designated instrument runway is 6,000 ft or less. Otherwise, the RVR group is omitted.
RVR is coded in the following format: The initial R is code for runway and is followed by the runway number. When more than one runway is defined with the same runway number, a directional letter is coded on the end of the runway number. Next is a solidus (/) followed by the visual range in feet, and then FT completes the RVR report. For example, an RVR value for Runway 01L of 800 ft would be coded R01L/0800FT. Most other countries use meters.
In the United States, RVR values are coded in increments of 100 ft up to 1,000 ft, increments of 200 ft from 1,000 to 3,000 ft, and increments of 500 ft from 3,000 to 6,000 ft. Manual RVR is not reported below 600 ft.
For U.S. airports only, the touchdown zone’s (TDZ) RVR is reported. For U.S. airports with multiple runways, the operating runway with the lowest touchdown RVR is reported. RVR may be reported for up to four designated runways in other countries.
When the RVR varies by more than one reportable value, the lowest and highest values will be shown with V between them, indicating variable conditions. For example, the 10-minute RVR for Runway 01L varying between 600 and 1,000 ft would be coded R01L/0600V1000FT.
If RVR is less than its lowest reportable value, the visual range group is preceded by M. For example, an RVR for Runway 01L of less than 600 ft is coded R01L/M0600FT.
If RVR is greater than its highest reportable value, the visual range group is preceded by a P. For example, an RVR for Runway 27 of greater than 6,000 ft will be coded R27/P6000FT.
Present Weather Group
METAR KOKC 011955Z AUTO 22015G25KT 180V250 3/4SM R17L/2600FT +TSRA BR OVC010CB 18/16 A2992 RMK AO2 TSB25 TS OHD MOV E SLP132
Present weather includes precipitation, obscurations, and other weather phenomena. The appropriate notations found in Table 24-3 are used to code present weather.
Table . METAR/SPECI Notations for Reporting Present Weather1
| Qualifier | Weather Phenomena | ||||
| Intensity or Proximity | Descriptor | Precipitation | Obscuration | Other | |
| 1 | 2 | 3 | 4 | 5 | |
| – Light Moderate2 + Heavy VC In the Vicinity3 | MI Shallow PR Partial BC Patches DR Low Drifting BL Blowing SH Shower(s) TS Thunderstorms FZ Freezing | DZ RA SN SG IC PL GR GS UP | Drizzle Rain Snow Snow Grains Ice Crystals (Diamond Dust) Ice Pellets Hail Snow Pellets Unknown Precipitation | BR Mist FG Fog FU Smoke VA Volcanic Ash DU Widespread Dust SA Sand HZ Haze PY Spray | PO Dust/Sand Whirls SQ Squalls FC Funnel Cloud, Tornado, or Waterspout4 SS Sandstorm DS Dust Storm |
- The weather groups are constructed by considering columns 1 through 5 in Table 24-3 in sequence (i.e., intensity followed by description, followed by weather phenomena). For example, heavy rain shower(s) is coded as +SHRA.
- To denote moderate intensity, no entry or symbol is used.
- See text for vicinity definitions.
- Tornadoes and waterspouts are coded as +FC.
Separate groups are used for each type of present weather. Each group is separated from the other by a space. METARs/SPECIs contain no more than three present weather groups.
When more than one type of present weather is reported at the same time, present weather is reported in the following order:
- Tornadic activity (tornado, funnel cloud, or waterspout).
- Thunderstorm(s) (with and without associated precipitation).
- Present weather in order of decreasing dominance (i.e., the most dominant type reported first).
- Left to right in Table 24-3 (columns 1 through 5).
Qualifiers may be used in various combinations to describe weather phenomena. Present weather qualifiers fall into two categories:
- Intensity or proximity, and
- Descriptors.
Intensity Qualifier
The intensity qualifiers are light, moderate, and heavy. They are coded with precipitation types, except ice crystals (IC) and hail (GR), including those associated with a thunderstorm (TS) and those of a showery nature (SH). Tornadoes and waterspouts are coded as heavy (+FC). No intensity is ascribed to the obscurations of blowing dust (BLDU), blowing sand (BLSA), and blowing snow (BLSN). Only moderate or heavy intensity is ascribed to sandstorm (SS) and dust storm (DS).
When more than one form of precipitation is occurring at a time, or precipitation is occurring with an obscuration, the reported intensities are not cumulative. The reported intensity will not be greater than the intensity for each form of precipitation. For example, -FZRAPL is light freezing rain and light ice pellets, not light freezing rain and moderate ice pellets.
Proximity Qualifier
Weather phenomena occurring beyond the point of observation (between 5 and 10 sm) are coded as in the vicinity (VC). VC can be coded in combination with thunderstorm (TS), fog (FG), shower(s) (SH), well-developed dust/sand whirls (PO), blowing dust (BLDU), blowing sand (BLSA), blowing snow (BLSN), sandstorm (SS), and dust storm (DS). Intensity qualifiers are not coded in conjunction with VC.
For example, VCFG can be decoded as meaning some form of fog is between 5 and 10 sm of the point of observation. If VCSH is coded, showers are occurring between 5 and 10 sm of the point of observation.
Weather phenomena occurring at the point of observation (at the station) or in the vicinity of the point of observation are coded in the body of the report. Weather phenomena observed beyond 10 sm from the point of observation (at the station) is not coded in the body, but may be coded in the remarks section.
Descriptor Qualifier
Descriptors are qualifiers that further amplify weather phenomena and are used in conjunction with some types of precipitation and obscurations. The descriptor qualifiers are: shallow (MI), partial (PR), patches (BC), low drifting (DR), blowing (BL), shower(s) (SH), thunderstorm (TS), and freezing (FZ).
Only one descriptor is coded for each weather phenomena group (e.g., FZDZ).
The descriptors shallow (MI), partial (PR), and patches (BC) are only coded with fog (FG) (e.g., MIFG). Mist (BR) is not coded with any descriptor.
The descriptors low drifting (DR) and blowing (BL) will only be coded with dust (DU), sand (SA), and snow (SN) (e.g., BLSN or DRSN). DR is coded with DU, SA, or SN for raised particles drifting less than 6 ft above the ground.
When blowing snow is observed with snow falling from clouds, both phenomena are reported (e.g., SN BLSN). If blowing snow is occurring and the observer cannot determine whether or not snow is also falling, then BLSN is reported. Spray (PY) is coded only with blowing (BL).
The descriptor for showery-type precipitation (SH) is coded only with one or more of the precipitation qualifiers for rain (RA), snow (SN), ice pellets (PL), or hail (GR). When any type of precipitation is coded with VC, the intensity and type of precipitation is not coded.
The descriptor for thunderstorm (TS) may be coded by itself when the thunderstorm is without associated precipitation. A thunderstorm may also be coded with the precipitation types of rain (RA), snow (SN), ice pellets (PL), snow pellets (GS), or hail (GR). TS is not coded with SH.
The descriptor freezing (FZ) is only coded in combination with fog (FG), drizzle (DZ), or rain (RA) (e.g., FZRA). FZ is not coded with SH.
Precipitation
Precipitation is any form of water particle, whether liquid or solid, that falls from the atmosphere and reaches the ground. The precipitation types are: drizzle (DZ), rain (RA), snow (SN), snow grains (SG), ice crystals (IC), ice pellets (PL), hail (GR), snow pellets (GS), and unknown precipitation (UP). UP is reported if an automated station detects the occurrence of precipitation, but the precipitation sensor cannot recognize the type.
Up to three types of precipitation may be coded in a single present weather group. They are coded in order of decreasing dominance based on intensity.
Obscuration
Obscurations are any phenomenon in the atmosphere, other than precipitation, that reduces the horizontal visibility in the atmosphere. The obscuration types are: mist (BR), fog (FG), smoke (FU), volcanic ash (VC), widespread dust (DU), sand (SA), haze (HZ), and spray (PY). Spray (PY) is coded only as BLPY.
With the exception of volcanic ash, low drifting dust, low drifting sand, low drifting snow, shallow fog, partial fog, and patches (of) fog, an obscuration is coded in the body of the report if the surface visibility is less than 7 mi, or considered operationally significant. Volcanic ash is always reported when observed.
Other Weather Phenomena
Other weather phenomenon types include: well-developed dust/sand whirls (PO), sandstorms (SS), dust storms (DS), squalls (SQ), funnel clouds (FC), and tornados and waterspouts (+FC).
Examples:
| -DZ | Light drizzle. |
| -RASN | Light rain and (light) snow. |
| SN BR | (Moderate) snow, mist. |
| -FZRA FG | Light freezing rain, fog. |
| SHRA | (Moderate) rain shower. |
| VCBLSA | Blowing sand in the vicinity. |
| -RASN FG HZ | Light rain and (light) snow, fog, haze. |
| TS | Thunderstorm (without precipitation). |
+TSRA Thunderstorm, heavy rain.
+FC TSRAGR BR Tornado, thunderstorm, (moderate) rain, hail, mist.
Sky Condition Group
METAR KOKC 011955Z AUTO 22015G25KT 180V250 3/4SM R17L/2600FT +TSRA BR OVC010CB 18/16 A2992 RMK AO2 TSB25 TS OHD MOV E SLP132
Sky condition is a description of the appearance of the sky. It includes cloud cover, vertical visibility, or clear skies.
The sky condition group is based on the amount of cloud cover (the first three letters) followed by the height of the base of the cloud cover (final three digits). No space is between the amount of cloud cover and the height of the layer. The height of the layer is recorded in feet AGL.
Sky condition is coded in ascending order and ends at the first overcast layer. At mountain stations, if the layer is below station level, the height of the layer will be coded with three solidi (///). Vertical visibility is coded as VV, followed by the vertical visibility into the indefinite ceiling. An “indefinite ceiling” is a ceiling classification applied when the reported ceiling value represents the vertical visibility upward into surface-based obscuration. No space is between the group identifier and the vertical visibility. Figure 24-3 illustrates the effect of an obscuration on the vision from a descending aircraft.
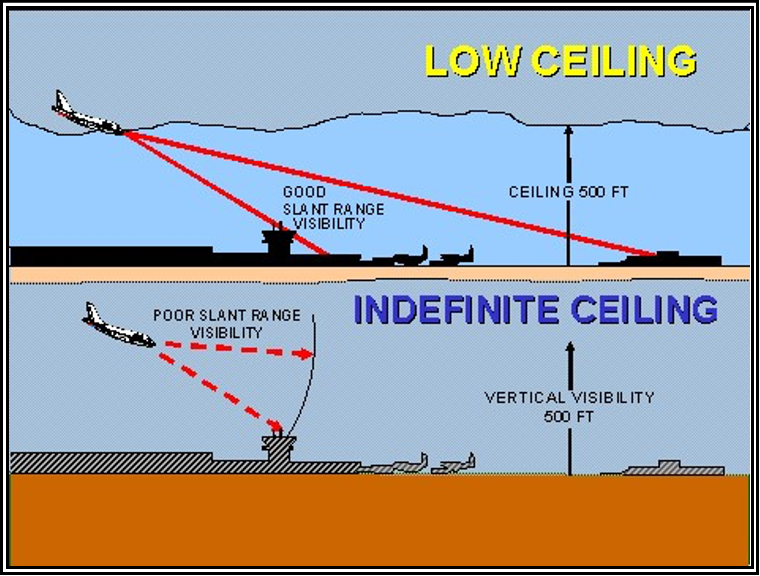
The ceiling is 500 ft in both examples, but the indefinite ceiling example (bottom) produces a more adverse impact to landing aircraft. This is because an obscuration (e.g., fog, blowing dust, snow) limits runway acquisition due to reduced slant range visibility. This pilot would be able to see the ground, but not the runway. If the pilot was at approach minimums, the approach could not be continued and a missed approach would need to be executed.
Figure . Obscuration Effects on Slant Range Visibility
Clear skies are coded in the format SKC or CLR. When SKC is used, an observer indicates no layers are present; CLR is used by automated stations to indicate no layers are detected at or below 12,000 ft.
Each coded layer is separated from the others by a space. Each layer reported is coded by using the appropriate reportable contraction seen in Table 24-4. A report of clear skies (SKC or CLR) is a complete layer report within itself. The abbreviations FEW, SCT, BKN, and OVC will be followed (without a space) by the height of the layer.
Table METAR/SPECI Contractions for Sky Cover
| Reportable Contraction | Meaning | Summation Amount of Layer |
| VV | Vertical Visibility | 8/8 |
| SKC or CLR1 | Clear | 0 |
| FEW2 | Few | 1/8 – 2/8 |
| SCT | Scattered | 3/8 – 4/8 |
| BKN | Broken | 5/8 – 7/8 |
| OVC | Overcast | 8/8 |
- The abbreviation CLR will be used at automated stations when no layers at or below 12,000 ft are reported; the abbreviation SKC will be used at manual stations when no layers are reported.
- Any layer amount less than 1/8 is reported as FEW.
The height is coded in hundreds of feet above the surface using three digits in accordance with Table 24-5. Table 24-5. METAR/SPECI Increments of Reportable Values of Sky Cover Height
| Range of Height Values (ft) | Reportable Increment (ft) |
| Less than or equal to 5,000 | To nearest 100 |
| 5,001 to 10,000 | To nearest 500 |
| Greater than 10,000 | To nearest 1,000 |
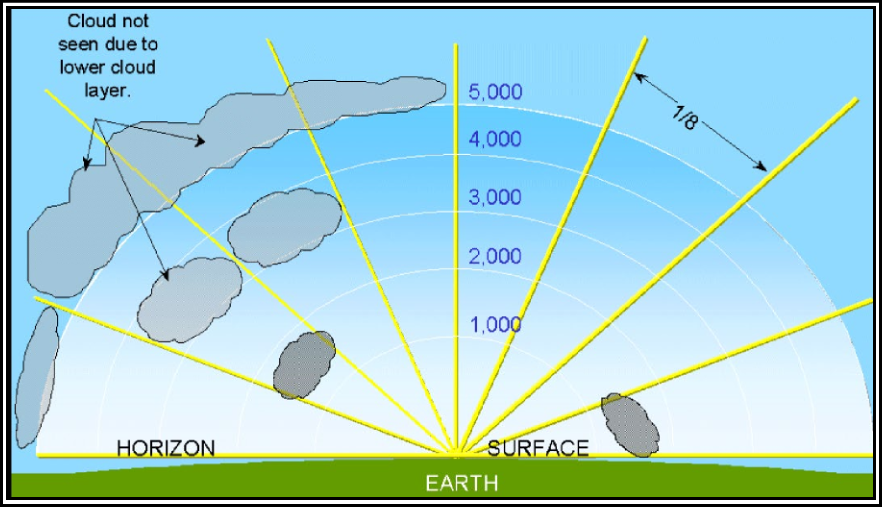
Clouds at 1,200 ft obscure 2/8 of the sky (FEW). Higher clouds at 3,000 ft obscure an additional 1/8 of the sky, and because the observer cannot see above the 1,200-ft layer, he is to assume that the higher 3,000-ft layer also exists above the lower layer (SCT). The highest clouds at 5,000 ft obscure 2/8 of the sky, and again since the observer cannot see past the 1,200 and 3,000-ft layers, he is to assume the higher 5,000-ft layer also exists above the lower layers (BKN). The sky condition group would be coded as: FEW012 SCT030 BKN050.
Figure . METAR/SPECI Sky Condition Coding
At manual stations, cumulonimbus (CB) or towering cumulus (TCU) is appended to the associated layer. For example, a scattered layer of towering cumulus at 1,500 ft would be coded SCT015TCU, and would be followed by a space if there were additional higher layers to code.
Examples:
| SKC | No layers are present. |
| CLR | No layers are detected at or below 12,000 ft AGL. |
| FEW004 | Few at 400 ft AGL. |
| SCT023TCU | Scattered layer of towering cumulus at 2,300 ft AGL. |
| BKN100 | Broken layer (ceiling) at 10,000 ft AGL. |
| OVC250 | Overcast layer (ceiling) at 25,000 ft AGL. |
| VV001 | Indefinite ceiling with a vertical visibility of 100 ft AGL. |
| FEW012 SCT046 | Few clouds at 1,200 ft, scattered layer at 4,600 ft AGL. |
| SCT033 BKN085 | Scattered layer at 3,300 ft, broken layer (ceiling) at 8,500 ft AGL. |
SCT018 OVC032CB Scattered layer at 1,800 ft AGL, overcast layer (ceiling) of cumulonimbus at 3,200 ft AGL.
SCT009 SCT024 BKN048 Scattered layer at 900 ft AGL, scattered layer at 2,400 ft AGL, broken layer (ceiling) at 4,800 ft AGL.
Temperature/Dewpoint Group
METAR KOKC 011955Z AUTO 22015G25KT 180V250 3/4SM R17L/2600FT +TSRA BR OVC010CB 18/16 A2992 RMK AO2 TSB25 TS OHD MOV E SLP132
Temperature is the degree of hotness or coldness of the ambient air, as measured by a suitable instrument. Dewpoint is the temperature to which a given parcel of air must be cooled at constant pressure and constant water vapor content for the air to become fully saturated.
Temperature and dewpoint are coded as two digits rounded to the nearest whole degree Celsius. For example, a temperature of 0.3 ºC would be coded at 00. Sub-zero temperatures and dewpoints are prefixed with an M. For example, a temperature of 4 ºC with a dewpoint of -2 ºC would be coded as 04/M02; a temperature of -2 ºC would be coded as M02.
If temperature is not available, the entire temperature/dewpoint group is not coded. If dewpoint is not available, temperature is coded followed by a solidus (/) and no entry is made for dewpoint. For example, a temperature of 1.5 ºC and a missing dewpoint would be coded as 02/.
Altimeter Group
METAR KOKC 011955Z AUTO 22015G25KT 180V250 3/4SM R17L/2600FT +TSRA BR OVC010CB 18/16 A2992 RMK AO2 TSB25 TS OHD MOV E SLP132
The altimeter setting group codes the current pressure at elevation. This setting is then used by aircraft altimeters to determine the true altitude above a fixed plane of MSL.
The altimeter group always starts with an A and is followed by the four-digit group representing the pressure in tens, units, tenths, and hundredths of inches of mercury. The decimal point is not coded. For example, an altimeter setting of 29.92 inHg would be coded as A2992.
Remarks (RMK)
METAR KOKC 011955Z AUTO 22015G25KT 180V250 3/4SM R17L/2600FT +TSRA BR OVC010CB 18/16 A2992 RMK AO2 TSB25 TS OHD MOV E SLP132
Remarks are included in METAR and SPECI, when appropriate.
Remarks are separated from the body of the report by the contraction RMK. When no remarks are necessary, the contraction RMK is not used.
METAR/SPECI remarks fall into two categories (see Table 24-6): • Automated, Manual, and Plain Language; and
- Additive and Automated Maintenance Data.
Table .METAR/SPECI Order of Remarks
| Automated, Manual, and Plain Language | Additive and Automated Maintenance Data | ||||
| 1. | Volcanic Eruptions | 14. | Hailstone Size | 27. | Precipitation Amount Within a Specified Time Period* |
| 2. | Funnel Cloud | 15. | Virga | 28. | Cloud Types* |
| 3. | Type of Automated Station | 16. | Variable Ceiling Height | 29. | Duration of Sunshine* |
| 4. | Peak Wind | 17. | Obscurations | 30. | Hourly Temperature and Dewpoint |
| 5. | Wind Shift | 18. | Variable Sky Condition | 31. | 6-Hourly Maximum Temperature* |
| 6. | Tower or Surface Visibility | 19. | Significant Cloud Types | 32. | 6-Hourly Minimum Temperature* |
| 7. | Variable Prevailing Visibility | 20. | Ceiling Height at Second Location | 33. | 24-Hour Maximum and Minimum Temperature* |
| 8. | Sector Visibility | 21. | Pressure Rising or Falling Rapidly | 34. | 3-Hourly Pressure Tendency* |
| 9. | Visibility at Second Location | 22. | Sea Level Pressure | 35. | Sensor Status Indicators |
| 10. | Lightning | 23. | Aircraft Mishap | 36. | Maintenance Indicator |
| 11. | Beginning and Ending of Precipitation | 24. | No SPECI Reports Taken | Note: Additive data is primarily used by the NWS for climatological purposes. *These groups should have no direct impact on the aviation community and will not be discussed in this document. | |
| 12. | Beginning and Ending of Thunderstorms | 25. | Snow Increasing Rapidly | ||
| 13. | Thunderstorm Location | 26. | Other Significant Information | ||
Remarks are made in accordance with the following:
- Time entries are made in minutes past the hour if the time reported occurs during the same hour the observation is taken. Hours and minutes are used if the hour is different.
- Present weather coded in the body of the report as VC may be further described (e.g., direction from the station, if known). Weather phenomena beyond 10 sm of the point(s) of observation are coded as distant (DSNT) followed by the direction from the station. For example, precipitation of unknown intensity within 10 sm east of the station would be coded as VCSH E; lightning 25 sm west of the station would be coded as LTG DSNT W.
- Distance remarks are in statute miles, except for automated lightning remarks, which are in nautical miles.
- Movement of clouds or weather, when known, is coded with respect to the direction toward which the phenomena are moving. For example, a thunderstorm moving toward the northeast would be coded as TS MOV NE.
- Directions use the eight points of the compass coded in a clockwise order.
- Insofar as possible, remarks are entered in the order they are presented in the following sections (and Table 24-6).
Automated, Manual, and Plain Language Remarks
These remarks generally elaborate on parameters reported in the body of the report. An automated station or observer may generate automated and manual remarks. Only an observer can provide plain language remarks.
Volcanic Eruptions
Volcanic eruptions are coded in plain language and contain the following, when known:
- Name of volcano;
- Latitude and longitude, or the direction and approximate distance from the station;
- Date/time (UTC) of the eruption;
- Size description, approximate height, and direction of movement of the ash cloud; and
- Any other pertinent data about the eruption.
For example, a remark on a volcanic eruption would look like the following:
RMK MT. AUGUSTINE VOLCANO 70 MILES SW ERUPTED AT 231505 LARGE ASH CLOUD EXTENDING TO APRX 30000 FEET MOVING NE.
Pre-eruption volcanic activity is not coded. Pre-eruption refers to unusual and/or increasing volcanic activity that could presage a volcanic eruption.
Funnel Cloud
At manual stations, tornadoes, funnel clouds, and waterspouts are coded in the following format: tornadic activity, TORNADO, FUNNEL CLOUD, or WATERSPOUT, followed by the beginning and/or ending time, followed by the location and/or direction of the phenomena from the station, and/or movement, when known. For example, TORNADO B13 6 NE would indicate that a tornado began at 13 minutes past the hour and was 6 sm northeast of the station.
Type of Automated Station
AO1 or AO2 is coded in all METARs/SPECIs from automated stations. Automated stations without a precipitation discriminator are identified as AO1; automated stations with a precipitation discriminator are identified as AO2.
Peak Wind
Peak wind is coded in the following format: the remark identifier PK WND, followed by the direction of the wind (first three digits), peak wind speed (next two or three digits) since the last METAR, and the time of occurrence. A space is between the two elements of the remark identifier and the wind direction/speed group; a solidus (/), without spaces, separates the wind direction/speed group and the time. For example, a peak wind of 45 kt from 280° that occurred at 15 minutes past the hour is coded PK WND 28045/15.
Wind Shift
Wind shift is coded in the following format: the remark identifier WSHFT, followed by the time the wind shift began. The contraction FROPA is entered following the time if there is reasonable data to consider the wind shift was the result of a frontal passage. A space is between the remark identifier and the time and, if applicable, between the time and the frontal passage contraction. For example, a remark reporting a wind shift accompanied by a frontal passage that began at 30 minutes past the hour would be coded WSHFT 30 FROPA.
Tower or Surface Visibility
Tower or surface visibility is coded in the following format: tower (TWR VIS) or surface (SFC), followed by the observed tower/surface visibility value. A space is coded between each of the remark elements. For example, the control tower visibility of 1½ sm would be coded TWR VIS 1 1/2.
Variable Prevailing Visibility
Variable prevailing visibility is coded in the following format: the remark identifier VIS, followed by the lowest and highest visibilities evaluated, separated by the letter V. A space follows the remark identifier, and no spaces are between the letter V and the lowest/highest values. For example, a visibility that was varying between ½ and 2 sm would be coded VIS 1/2V2.
Sector Visibility
Sector visibility is coded at manual stations in the following format: the remark identifier VIS, followed by the sector referenced to eight points of the compass, and the sector visibility in statute miles. For example, a visibility of 2½ sm in the northeastern octant is coded VIS NE 2 1/2.
Visibility at Second Location
At designated automated stations, the visibility at a second location is coded in the following format: the remark identifier VIS, followed by the measured visibility value and the specific location of the visibility sensor(s) at the station. This remark will only be generated when the condition is lower than that contained in the body of the report. For example, a visibility of 2½ sm measured by a second sensor located at Runway 11 is coded VIS 2 1/2 RWY11.
Lightning
When lightning is observed at a manual station, the frequency, type of lightning, and location are reported. The contractions for the type and frequency of lightning are based on Table 24-7 (e.g., OCNL LTGICCG NW, FRQ LTG VC, or LTG DSNT W).
When lightning is detected by an automated system:
- Within 5 NM of the Airport Location Point (ALP), it is reported as TS in the body of the report with no remark.
- Between 5 and 10 NM of the ALP, it is reported as VCTS in the body of the report with no remark.
- Beyond 10 but less than 30 NM of the ALP, it is reported in remarks only as LTG DSNT, followed by the direction from the ALP.
Table . METAR/SPECI Type and Frequency of Lightning
| Type of Lightning | ||
| Type | Contraction | Definition |
| Cloud-Ground | CG | Lightning occurring between cloud and ground. |
| In-Cloud | IC | Lightning that takes place within the cloud. |
| Cloud-Cloud | CC | Streaks of lightning reaching from one cloud to another. |
| Cloud-Air | CA | Streaks of lightning that pass from a cloud to the air, but do not strike the ground. |
| Frequency of Lightning | ||
| Frequency | Contraction | Definition |
| Occasional | OCNL | Less than 1 flash/minute. |
| Frequent | FRQ | About 1 to 6 flashes/minute. |
| Continuous | CONS | More than 6 flashes/minute. |
Beginning and Ending of Precipitation
At designated stations, the beginning and ending times of precipitation are coded in the following format: the type of precipitation, followed by either a B for beginning or an E for ending, and the time of occurrence. No spaces are coded between the elements. The coded times of the precipitation start and stop times are found in the remarks section of the next METAR. The times are not required to be in the SPECI. The intensity qualifiers are coded. For example, if rain began at 0005 and ended at 0030, and then snow began at 0020 and ended at 0055, the remark would be coded RAB05E30SNB20E55. If the precipitation was showery, the remark is coded SHRAB05E30SHSNB20E55. If rain ended and snow began at 0042, the remark would be coded as RAESNB42.
Beginning and Ending of Thunderstorms
The beginning and ending times of thunderstorms are coded in the following format: the thunderstorm identifier TS, followed by either a B for beginning or an E for ending, and the time of occurrence. No spaces are between the elements. For example, if a thunderstorm began at 0159 and ended at 0230, the remark is coded TSB0159E30.
Thunderstorm Location
Thunderstorm locations are coded in the following format: the thunderstorm identifier TS, followed by the location of the thunderstorm(s) from the station, and the direction of movement, when known. For example, a thunderstorm southeast of the station and moving toward the northeast is coded TS SE MOV NE.
Hailstone Size
At designated stations, the hailstone size is coded in the following format: the hail identifier GR, followed by the size of the largest hailstone. The hailstone size is coded in ¼ in increments. For example, GR 1 3/4 would indicate that the largest hailstones were 1¾ in in diameter. When small hail with a size less than ¼ in is occurring, the hailstone size is reported in the remarks as GR LESS THAN 1⁄4 in.
Virga
At designated stations, virga is coded in the following format: the identifier VIRGA, followed by the direction from the station. The direction of the phenomena from the station is optional (e.g., VIRGA or VIRGA SW).
Variable Ceiling Height
The variable ceiling height is coded in the following format: the identifier CIG, followed by the lowest ceiling height recorded, V denoting variability between two values, and ending with the highest ceiling height. A single space follows the identifier with no other spaces between the letter V and the lowest/highest ceiling values. For example, CIG 005V010 would indicate a ceiling is variable between 500 and 1,000 ft.
Obscurations
Obscurations, surface-based or aloft, are coded in the following format: the weather identifier causing the obscuration at the surface or aloft, followed by the sky cover of the obscuration aloft (FEW, SCT, BKN, OVC) or at the surface (FEW, SCT, BKN), and the height. Surface-based obscurations have a height of 000. A space separates the weather causing the obscuration and the sky cover; no space is between the sky cover and the height. For example, fog hiding 3/8 to 4/8 of the sky is coded FG SCT000; a broken layer at 2,000 ft composed of smoke is coded FU BKN020.
Variable Sky Condition
Variable sky condition remarks are coded in the following format: the two operationally significant sky conditions (FEW, SCT, BKN, and OVC), separated by spaces, and V denoting the variability between the two ranges. If several layers have the same condition amount, the layer height of the variable layer is coded. For example, a cloud layer at 1,400 ft varying between broken and overcast is coded BKN014 V OVC.
Significant Cloud Types
At manual stations, significant cloud type remarks are coded in all reports.
Cumulonimbus
Cumulonimbus not associated with thunderstorms is coded as CB, followed by the direction from the station, and the direction of movement, when known. The location, direction, and direction of movement entries are separated from each other by a space. For example, a cumulonimbus up to 10 sm west of the station moving toward the east would be coded CB W MOV E. If the cumulonimbus was more than 10 sm to the west, the remark is coded CB DSNT W.
Towering Cumulus
Towering cumulus clouds are coded in the following format: the identifier TCU, followed by the direction from the station. The cloud type and direction entries are separated by a space. For example, a towering cumulus cloud up to 10 sm west of the station is coded TCU W.
Standing Lenticular or Rotor Clouds
Stratocumulus (SCSL), altocumulus (ACSL), cirrocumulus (CCSL), or rotor clouds are coded in the following format: the cloud type followed by the direction from the station. The cloud type and direction entries are separated by a space. For example, altocumulus standing lenticular clouds observed southwest through west of the station are coded ACSL SW-W.
Ceiling Height at Second Location
At designated stations, the ceiling height at a second location is coded in the following format: the identifier CIG, followed by the measured height of the ceiling and the specific location of the ceilometer(s) at the station. This remark is only generated when the ceiling is lower than that contained in the body of the report. For example, if the ceiling measured by a second sensor located at Runway 11 is broken at 200 ft, the remark would be coded CIG 002 RWY11.
Pressure Rising or Falling Rapidly
At designated stations, the reported pressure is evaluated to determine if a pressure change is occurring. If the pressure is rising or falling at a rate of at least 0.06 in per hour and the pressure change totals 0.02 in or more at the time of the observation, a pressure change remark is reported. When the pressure is rising or falling rapidly at the time of observation, the remark pressure rising rapidly (PRESRR) or pressure falling rapidly (PRESFR) is included in the remarks.
Sea Level Pressure
At designated stations, the sea level pressure is coded in the following format: the identifier SLP, immediately followed by the sea level pressure in millibars. The hundreds and thousands units are not coded and must be inferred. For example, a sea level pressure of 998.2 mb is coded SLP982. A sea level pressure of 1,013.2 mb would be coded SLP132. For a METAR, if sea level pressure is not available, it is coded SLPNO.
Aircraft Mishap
If a SPECI is taken to document weather conditions when notified of an aircraft mishap, the remark ACFT MSHP is coded in the report, but the SPECI is not transmitted.
No SPECI Reports Taken
At manual stations where SPECIs are not taken, the remark NOSPECI is coded to indicate that no changes in weather conditions will be reported until the next METAR.
Snow Increasing Rapidly
At designated stations, the snow increasing rapidly remark is reported in the next METAR whenever the snow depth increases by 1 in or more in the past hour. The remark is coded in the following format: the remark indicator SNINCR, the depth increase in the past hour, and the total depth of snow on the ground at the time of the report. The depth of snow increase in the past hour and the total depth on the ground are separated from each other by a solidus (/). For example, a snow depth increase of 2 in in the past hour with a total depth on the ground of 10 in is coded SNINCR 2/10.
Other Significant Information
Agencies may add to a report other information significant to their operations, such as information on fog dispersal operations, runway conditions, FIRST or LAST reports from station, etc.
Additive and Automated Maintenance Data
Additive data groups are only reported at designated stations and are primarily used by the NWS for climatological purposes. Most have no direct impact on the aviation community, but a few are discussed below.
Hourly Temperature and Dewpoint
At designated stations, the hourly temperature and dewpoint group are further coded to the tenth of a degree Celsius. For example, a recorded temperature of +2.6 ºC and dewpoint of -1.5 ºC would be coded T00261015.
The format for the coding is as follows:
T Group indicator
- Indicates the following number is positive; a 1 would be used if the temperature was reported as negative at the time of observation
026 Temperature disseminated to the nearest tenth and read as 02.6
- Indicates the following number is negative; a 0 would be used if the number was reported as positive at the time of observation
015 Dewpoint disseminated to the nearest tenth and read as 01.5
No spaces are between the entries. For example, a temperature of 2.6 ºC and dewpoint of -1.5 ºC is reported in the body of the report as 03/M01 and the hourly temperature and dewpoint group as T00261015. If the dewpoint is missing, only the temperature is reported; if the temperature is missing, the hourly temperature and dewpoint group are not reported.
Maintenance Data Groups
The following maintenance data groups, sensor status indicators and the maintenance indicator, are only reported from automated stations.
Sensor Status Indicators
Sensor status indicators are reported as indicated below:
- If the RVR is missing and would normally be reported, RVRNO is coded.
- When automated stations are equipped with a present weather identifier and the sensor is not operating, the remark PWINO is coded.
- When automated stations are equipped with a tipping bucket rain gauge and the sensor is not operating, PNO is coded.
- When automated stations are equipped with a freezing rain sensor and the sensor is not operating, the remark FZRANO is coded.
- When automated stations are equipped with a lightning detection system and the sensor is not operating, the remark TSNO is coded.
- When automated stations are equipped with a secondary visibility sensor and the sensor is not operating, the remark VISNO LOC is coded.
- When automated stations are equipped with a secondary ceiling height indicator and the sensor is not operating, the remark CHINO LOC is coded.
Maintenance Indicator
A maintenance indicator ($) is coded when an automated system detects that maintenance is needed on the system.
Aircraft Observations and Reports
There are three kinds of aircraft observations: PIREPs, Aircraft Reports (AIREP), and Volcanic Activity Reports (VAR). Both PIREPs and AIREPS have two types:
- Routine PIREPs and Urgent PIREPs.
- Routine AIREPs and Special AIREPs.
PIREPs are reported by the pilot (or aircrew), while AIREPs can either be reported by the pilot or generated from sensors onboard the aircraft (automated AIREPs). PIREPs and AIREPs are coded differently. The PIREP format is a U.S.-only format. The AIREP format is used worldwide. Automated AIREPs are common over the United States.
The VAR is a report for aircraft encounters with volcanic ash and/or sulfur dioxide (SO2).
Pilot Weather Reports (PIREP)
Pilots can report any observation, good or bad, to assist other pilots with flight planning and preparation. If conditions were forecasted to occur but not encountered, a pilot can also report the observed condition. This will help the NWS verify forecast products and create more accurate products for the aviation community. A PIREP is prepared using a prescribed format (see Figure 24-5). Elements for all PIREPs are: message type, location, time, altitude/FL, type aircraft, and at least one other element to describe the reported phenomena. The other elements are omitted when no data is reported. All altitude references are mean sea level unless otherwise noted. Distance for visibility is in statute miles and all other distances are in nautical miles. Time is reported in Coordinated Universal Time
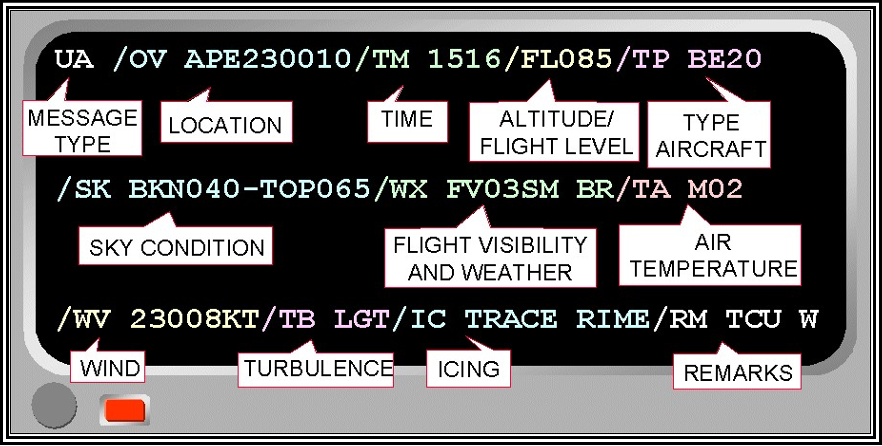
Figure . PIREP Coding Format
Message Type (UUA/UA)
Urgent PIREPs
Urgent (UUA) PIREPs contain information about:
- Tornadoes, funnel clouds, or waterspouts;
- Severe or extreme turbulence (including CAT);
- Severe icing;
- Hail;
- LLWS within 2,000 ft of the surface (LLWS PIREPs are classified as UUA if the pilot reports air speed fluctuations of 10 kt or more; or if air speed fluctuations are not reported but LLWS is reported, the PIREP is classified as UUA);
- Volcanic ash clouds; and/or
- Any other weather phenomena reported that are considered by the air traffic controller or Flight Service specialist receiving the report as being hazardous, or potentially hazardous, to flight operations.
Routine PIREPs
Routine (UA) PIREPs are issued after receiving a report from a pilot that does not contain any urgent information as listed in Section
Location (/OV)
The location (/OV) is the position reference where the phenomenon occurred. It is not the location of the aircraft when the report is submitted. Location can be referenced either by geographical position or by route segment. A position reference is preferred by meteorologists to aid forecast precision, monitoring, and verification.
Geographical Position
Geographical position can be referenced to a VHF Navigational Aid (NAVAID) or an airport, using either the three-letter IATA or four-letter ICAO identifier. If appropriate, the PIREP is encoded using the identifier, then three digits to define a radial and three digits to define the distance in nautical miles.
Examples:
| /OV APE | Over the Appleton VHF omni-directional range station (VOR). |
| /OV KJFK | Over John F. Kennedy International Airport, New York, NY. |
| /OV APE230010 | 230° at 10 NM from the Appleton VOR. |
| /OV KJFK107080 | 107° at 80 NM from John F. Kennedy International Airport, New York, NY. |
Route Segment
A PIREP can also be referenced using two or more fixes to describe a route.
Examples:
/OV KSTL-KMKC From St. Louis Lambert International Airport, St. Louis, MO, to
Charles B. Wheeler Downtown Airport, Kansas City, MO.
/OV KSTL090030-KMKC045015 From 90° at 30 NM from St. Louis Lambert International Airport, St. Louis, MO, to 45° at 15 NM from Charles B. Wheeler Downtown Airport, Kansas City, MO.
Time (/TM)
Time (/TM) is the time when the reported phenomenon occurred or was encountered. It is coded in four digits UTC.
Example:
/TM 1315 1315 UTC.
Altitude/Flight Level (/FL)
The altitude/flight level (/FL) is the altitude in hundreds of feet MSL where the phenomenon was first encountered. If not known, UNKN is entered. If the aircraft was climbing or descending, the appropriate contraction (DURC or DURD) is entered in the remarks (/RM). If the condition was encountered within a layer, the altitude range is entered within the appropriate element that describes the condition.
Examples:
/FL085 8,500 ft MSL.
/FL310 Flight level 310.
/FLUNKN /RM DURC Flight level unknown, remarks, during climb.
Aircraft Type (/TP)
Aircraft type (/TP) is entered. If not known, UNKN is entered. Icing and turbulence reports always include aircraft type.
Examples:
| /TP BE20 | Super King Air 200. |
| /TP SR22 | Cirrus 22. |
| /TP P28R | Piper Arrow. |
| /TP UNKN | Type unknown. |
Sky Condition (/SK)
The sky condition (/SK) group is used to report height of cloud bases, tops, and cloud cover. The height of base of a layer of clouds is coded in hundreds of feet MSL. The top of a layer is entered in hundreds of feet MSL preceded by the word TOP. If reported as clear above the highest cloud layer, SKC is coded following the reported level.
Examples:
| /BKN040-TOP065 | Base of broken layer 4,000 ft MSL, top 6,500 ft MSL. |
| /SK OVC100-TOP110/ SKC | Base of an overcast layer 10,000 ft MSL, top 11,000 ft MSL, clear above. |
| /SK OVC015-TOP035/OVC230 | Base of an overcast layer 1,500 ft MSL, top 3,500 ft MSL, base of an overcast layer 23,000 ft MSL. |
| /SK OVC-TOP085 | Overcast layer, top 8,500 ft MSL. |
Cloud cover amount ranges are entered with a hyphen separating the amounts (e.g., BKN-OVC).
Examples:
| /SK SCT-BKN050-TOP100 | Base of a scattered to broken layer 5,000 ft MSL, top 10,000 ft MSL. |
| /SK BKN-OVCUNKN-TOP060/BKN120-TOP150/ SKC | Base of a broken to overcast layer unknown, top 6,000 ft MSL, base of a broken layer 12,000 ft MSL, top 15,000 ft MSL, clear above. |
Unknown heights are indicated by the contraction UNKN.
Examples:
/SK OVC065-TOPUNKN Base of an overcast layer 6,500 ft MSL, top unknown. If a pilot indicates being in the clouds, IMC is entered.
/SK OVC065-TOPUNKN /RM IMC Base of an overcast layer 6,500 ft MSL, top unknown,
remark, in the clouds. When more than one layer is reported, layers are separated by a solidus (/).
Flight Visibility and Weather (/WX)
The pilot reports the weather conditions encountered as follows: flight visibility, when reported, is entered first in the /WX field. It is coded FV followed by a two-digit visibility value rounded down, if necessary, to the nearest whole statute mile and appended with SM (e.g., FV03SM). If visibility is reported as unrestricted, FV99SM is entered.
Flight weather types are entered using one or more of the surface weather reporting phenomena contained in Table 24-3.
Example:
/WX FV01SM +DS000-TOP083/SKC /RM DURC Flight visibility 1 sm, base heavy dust storm
layer at the surface, top 8,300 ft MSL, clear above, remarks, during climb.
When more than one form of precipitation is combined in the report, the dominant type is reported first.
Examples:
| /WX FV00SM +TSRAGR | Flight visibility 0 sm, thunderstorm, heavy rain, hail. |
| /WX FV02SM BRHZ000-TOP083 | Flight visibility 2 sm, base of a haze and mist layer at the surface, top 8,300 ft MSL. |
If a funnel cloud is reported, it is coded FC following the /WX group and is spelled out as FUNNEL
CLOUD after the /RM group. If a tornado or waterspout is reported, it is coded +FC following the /WX group, and TORNADO or WATERSPOUT is spelled out after the /RM group.
Examples:
/WX FC /RM FUNNEL CLOUD Funnel cloud, remarks, funnel cloud.
/WX +FC /RM TORNADO Tornado, remarks, tornado.
When more than one type of weather is reported, they are reported in the following order:
- TORNADO, WATERSPOUT, or FUNNEL CLOUD.
- Thunderstorm with or without associated precipitation.
- Weather phenomena in order of decreasing predominance.
- No more than three groups are used in a single PIREP.
- Weather layers are entered with the base and/or top of the layer when reported. The same format as in the sky condition (/SK) group is used.
Example:
/WX FU002-TOP030 Base of a smoke layer, 200 ft MSL, top 3,000 ft MSL.
Air Temperature (/TA)
Outside air temperature (/TA) is reported using two digits in degrees Celsius. Negative temperatures are prefixed with an M (e.g., /TA 08 or /TA M08).
Wind Direction and Speed (/WV)
Wind direction and speed are encoded using three digits to indicate wind direction, relative to magnetic north, and two or three digits to indicate reported wind speed. When the reported speed is less than 10 kt, a leading 0 is used. The wind group will always have KT appended to represent the units in knots.
Examples:
/WV 02009KT Wind 20° at 9 kt.
/WV 28057KT Wind 280° at 57 kt.
/WV 350102KT Wind 350° at 102 kt.
Turbulence (/TB)
Turbulence intensity, type, and altitude are reported after wind direction and speed.
Duration (intermittent (INTMT), occasional (OCNL), or continuous (CONS)) is coded first (if reported by the pilot), followed by the intensity (light (LGT), moderate (MOD), severe (SEV), or extreme (EXTRM)). Range or variation of intensity is separated with a hyphen (e.g., MOD-SEV). If turbulence was forecast, but not encountered, negative (NEG) is entered.
Type is coded second. CAT or CHOP is entered if reported by the pilot. High-level turbulence not associated with clouds (including thunderstorms) is reported as CAT.
Altitude is reported last, and only if it differs from the value reported in the altitude/flight level (/FL) group. When a layer of turbulence is reported, height values are separated with a hyphen. If lower or upper limits are not defined, below (BLO) or above (ABV) is used.
Examples:
/TB LGT Light turbulence.
/TB LGT 040 Light turbulence at 4,000 ft MSL.
/TB OCNL MOD-SEV BLO 080 Occasional moderate to severe turbulence below
8,000 ft MSL.
/TB MOD-SEV CAT 350 Moderate to severe CAT at 35,000 ft MSL.
/TB NEG 120-180 Negative turbulence between 12,000 and
18,000 ft MSL.
/TB CONS MOD CHOP 220/NEG 230-280 Continuous moderate chop at 22,000 ft MSL, negative turbulence between 23,000 and 28,000 ft MSL.
/TB MOD CAT ABV 290 Moderate CAT above 29,000 ft MSL.
Turbulence reports should include location, altitude (or range of altitudes), and aircraft type, as well as, when reported, whether in clouds or clear air. The pilot determines the degree of turbulence, intensity, and duration (occasional, intermittent, or continuous). Reports should be obtained and disseminated, when possible, in conformance with the Turbulence Reporting Criteria Table in the AIM, Chapter 7, Section 1, Meteorology.
Icing (/IC)
Icing intensity, type, and altitude are reported after turbulence.
Intensity is coded first using contractions TRACE, light (LGT), moderate (MOD), or severe (SEV). Reports of a range or variation of intensity is separated with a hyphen. If icing was forecast but not encountered, negative (NEG) is coded. Icing type is reported second. Reportable types are RIME, clear (CLR), or mixed (MX).
The AIM, Chapter 7, Section 1, Meteorology provides classification of icing intensity, according to its operational effects on aircraft, as well as tables of icing types and icing conditions.
The reported icing/altitude is coded last, and only if different from the value reported in the altitude/flight level (/FL) group. A hyphen is used to separate reported layers of icing. Above (ABV) or below (BLO) is coded when a layer is not defined.
Pilot reports of icing should also include air temperature (/TA).
Examples:
/IC LGT-MOD MX 085 Light to moderate mixed icing, 8,500 ft MSL.
/IC LGT RIME Light rime icing.
/IC MOD RIME BLO 095 Moderate rime icing below 9,500 ft MSL.
/IC SEV CLR 035-062 Severe clear icing 3,500 to 6,200 ft MSL.
Remarks (/RM)
The remarks (/RM) group is used to report a phenomenon that is considered important but does not fit in any of the other groups. This includes, but is not limited to, LLWS reports, thunderstorm lines, coverage and movement, lightning, SO2 gas smell, clouds observed but not encountered, and geographical or local descriptions of where the phenomenon occurred. Hazardous weather is reported first. LLWS is described to the extent possible.
Wind Shear
Fluctuations in wind speed 10 kt or more (+/-10 kt), within 2,000 ft of the surface, are issued as an Urgent (UUA) PIREP. When LLWS is entered in a PIREP, LLWS is entered as the first remark in the remarks (/RM) group.
Example:
/RM LLWS +/-15 KT SFC-008 DURC RY22 JFK Remarks, LLWS, air speed fluctuations of plus or minus 15 kt, surface to 800 ft during climb, Runway 22, John F. Kennedy International Airport, New York, NY.
Funnel Cloud, Tornado, and Waterspout
FUNNEL CLOUD, TORNADO, and WATERSPOUT are entered with the direction of movement, when reported.
Example:
/RM TORNADO W MOV E Remarks, tornado west moving east.
Thunderstorm
Thunderstorm coverage is coded as isolated (ISOL), few (FEW), scattered (SCT), or numerous (NMRS), followed by a description as line (LN), broken line (BKN LN), or solid line (SLD LN), when reported.
This is followed with TS, the location and movement, and the type of lightning, when reported.
Example:
/RM NMRS TS S MOV E Remarks, numerous thunderstorms south moving east.
Lightning
Lightning frequency is coded as occasional (OCNL) or frequent (FRQ), followed by type as lightning in cloud (LTGIC), lightning cloud to cloud (LTGCC), lightning cloud to ground (LTGCG), lightning cloud to air (LTGCA), or combinations, when reported.
Example:
/RM OCNL LTGICCG Remarks, occasional lighting in cloud, cloud to ground.
Electrical Discharge
For an electrical discharge, DISCHARGE is coded followed by the altitude.
Example:
/RM DISCHARGE 120 Remarks, discharge, 12,000 ft MSL.
Clouds
Remarks are used when clouds can be seen but were not encountered and reported in the sky condition group (/SK).
Examples:
/RM CB E MOV N Remarks, cumulonimbus east moving north.
/RM OVC BLO Remarks, overcast below.
Other Remarks
Remarks that do not fit in other groups, like during climb (DURC), during descent (DURD), reach cruising altitude (RCA), or top of climb (TOP or TOC), may be included. If specific phraseology or contractions are not adequate, plain language is used to describe the phenomena or local geographic locations.
Example:
/RM DONNER SUMMIT PASS
Volcanic Eruptions
Volcanic ash alone is an Urgent PIREP. A report of volcanic activity includes as much information as possible, including the name of the mountain, ash cloud and movement, height of the top and bottom of the ash, etc.
Example:
/UUA/OV ANC240075/TM 2110/FL370/TP DC10/WX VA/RM VOLCANIC ERUPTION 2008Z MT AUGUSTINE ASH 40S MOV SSE
Urgent PIREP, 240° at 75 NM from Anchorage International Airport, Anchorage, AK, 2110 UTC, FL370, a DC-10 reported volcanic ash, remarks, volcanic eruption occurred at 2008 UTC Mount Augustine, ash 40 NM south moving south-southeast.
Skyspotter
The SKYSPOTTER program is a result of a recommendation from the “Safer Skies” FAA/Industry Joint Safety Analysis and Implementation Teams. The term SKYSPOTTER indicates a pilot has received specialized training in observing and reporting in-flight weather phenomena or PIREPs.
When a PIREP is received from a pilot identifying themselves as a SKYSPOTTER aircraft, the additional comment “/AWC” is added at the end of the remarks section of the PIREP.
An AWC-WEB/xxxx in the remarks indicates the PIREP was submitted by an airline dispatcher or CWSU meteorologist directly to the AWC. The “xxxx” represents the airline abbreviation or ARTCC of the CWSU that submitted the PIREP.
Example:
PIREP TEXT/RM REMARKS/AWC PIREP TEXT/RM REMARKS/AWC-WEB/KZFW
Aircraft Reports (AIREP)
AIREPs are messages from an aircraft to a ground station. AIREPs are normally comprised of the aircraft’s position, time, FL, ETA over its next reporting point, destination ETA, fuel remaining, and meteorological information. It is beyond the scope of this document to describe the details of all the elements in the AIREP, but this section will focus on the meteorological information.
The AWC’s website provides AIREPs over the CONUS and portions of the Atlantic and Pacific Oceans.
AIREP Types and Content
There are two types of AIREPs: routine or position report (ARP) and special (ARS). AIREPs can be reported by the pilot, but the majority of routine AIREPs are automated and downlinked from the aircraft to a service provider (e.g., a flight planning company) for processing and forwarding to an airline and the
NWS.
The majority of AIREPs report wind and temperature at selected intervals along the flight route, derived from onboard sensors and probes. Some aircraft are equipped with sensors and probes to measure humidity/water vapor, turbulence, and icing data.
The format for the AIREP is governed by the WMO and ICAO. The AWC’s website includes AIREPs on their PIREP web page that is formatted for web display, with some weather elements decoded.
AIREP Examples
The following examples are from the AWC’s website. The actual airline’s call sign was replaced with a fictitious call sign, and the Special AIREP was created from the routine report.
Routine AIREP Example
ARP XXX836 2443N 15516W 2229 F350 M43 315/128 TB LGT
| ARP | Routine report. |
| XXX836 | Aircraft call sign. |
| 2423N 15516W | Location in latitude and longitude, 24° and 23 minutes north, 155° and 16 minutes west. |
| F350 | Flight level or altitude, FL350. |
| M43 | Temperature in Celsius, minus 43 ºC. |
| 315/128 | Wind direction (reference to true north) and speed, 315° and 128 kt. |
| TB LGT | Light turbulence. |
Special AIREP Example
ARS XXX836 2443N 15516W 2229 F350 M43 315/128 TB SEV
ARS Special AIREP.
Same as the routine example except:
TB SEV Severe turbulence.
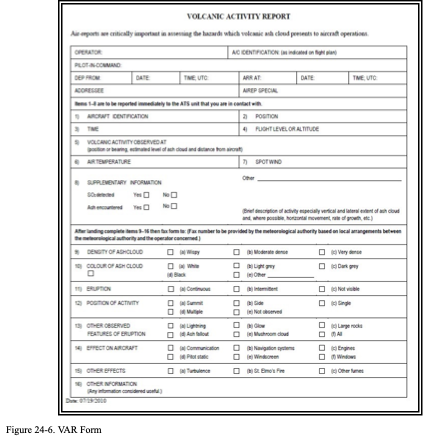
Volcanic Activity Reports (VAR)
The VAR (see Figure 24-6) is a report for aircraft encounters with volcanic ash and/or SO2 clouds. The first part of the VAR is reported to ATC (as an Urgent PIREP or Special AIREP) as soon as practical. The second part of the VAR is submitted postflight. The VAR is used by volcano scientists and forecasters to better understand the characteristics of volcanic eruptions, including their volcanic ash and/or SO2 clouds. Additional information can be found in FAA Order 8900.1, Volume 3, Chapter 26, Section 7, Safety Assurance System: Volcanic Ash Avoidance, Concepts, Policies, and Guidance
Turbulence Observations
Since the 1990s, several innovations have improved the quality and availability of turbulence reports. Automated turbulence reporting systems are common on many commercial aircraft using the Aircraft Meteorological Data Relay (AMDAR) system.
Modern commercial aircraft are equipped with meteorological sensors and associated sophisticated data acquisition and processing systems. These systems continuously record meteorological information on the aircraft and send these observations at selected intervals to ground stations via satellite or radio links where they are processed and disseminated.[1] Participating airlines add turbulence information with these reports. See Figure 24-7 for a plot of AMDAR reports from 2019.
AMDAR reports turbulence in terms of Eddy Dissipation Rate (EDR). EDR is the ICAO standard dimension for automated turbulence reporting. EDR is a state of the atmosphere measure rather than a state of the aircraft measure, and so it is independent of aircraft type. Note: This information is restricted.
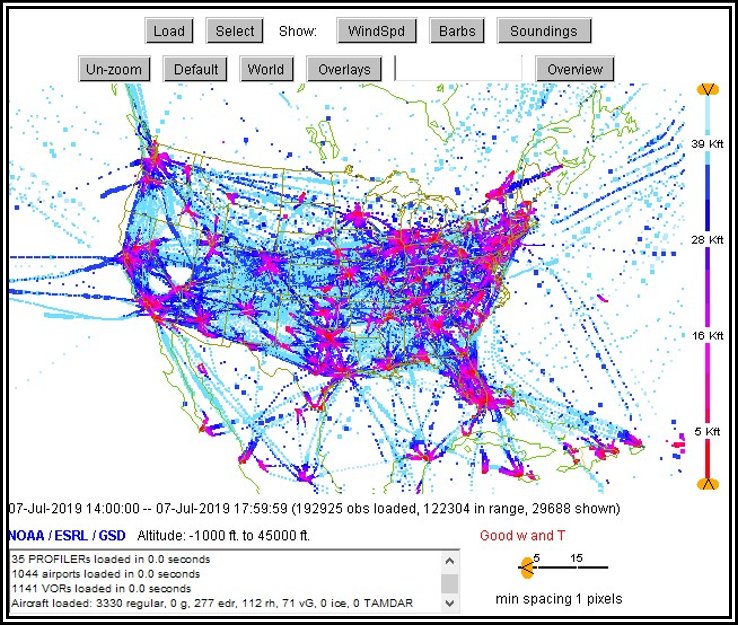
Figure . A Plot of AMDAR Reports Received During a 24-Hour Period in 2019
Radar Observations
Weather Surveillance Radar—1988 Doppler (WSR-88D) Description
Weather radar observations and their resultant images are graphical displays of precipitation and nonprecipitation targets detected by weather radars. WSR-88D, also known as NEXRAD, displays these targets on a variety of products, which can be found on the websites of all NWS WFOs, the AWC, the SPC, and websites and phone applications of various flight planning and weather service providers.
For information on radar basics, see Chapter 15, Weather Radar.
Issuance
WSR-88D radars are continuously generating radar observations. Each radar observation, called a volume scan, consists of 5 to 14 separate elevation “tilts,” and takes between 4 and 11 minutes to generate, depending on the radar’s mode of operation. Once one observation is complete, the next one begins. Radar observation times are not standard, nor are they synchronized with other radars. The valid time of the observation is the time assigned to the product, which is the end of the last radar scan.
WSR-88D Radar (NEXRAD) Network The WSR-88D radar network consists of 160 radars operated by the NWS, FAA, and DOD.
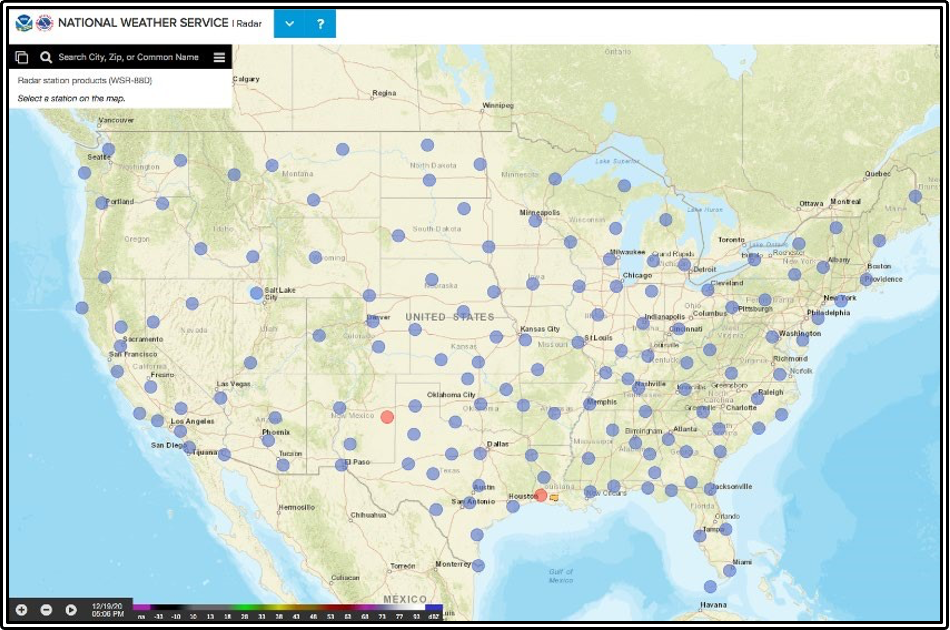
Locations of WSR-88D weather radar are indicated by gray circles. Red circles indicate radars that are temporarily out of service.
Figure . Locations of WSR-88D Weather Radar in the CONUS
Figure . WSR-88D Weather Radar Coverage at 3,000 ft AGL, 6,000 ft AGL, and 10,000 ft AGL over the CONUS and Puerto Rico
Figure . Additional Locations of WSR-88D Weather Radar and Coverage Outside of the CONUS
Coverage
Figure 24-9 and Figure 24-10 depict the radar coverage at 3,000 ft AGL, 6,000 ft AGL, and 10,000 ft AGL (i.e., above the height of the radar). Several WSR-88D radars are located in mountainous areas, such as the western United States. For example, the radar in southern Utah (near Cedar City) is on top of a 10,000-ft mountain. This means that the coverage begins at 10,000 ft AGL in that area. Any precipitation from low-topped clouds would not be detected by this radar due to overshooting of the radar beam (see Section 15.2.8).
Modes of Operation
The WSR-88D employs scanning strategies in which the antenna automatically raises to higher and higher preset angles (or elevation scans) as it rotates. These elevation scans comprise a volume coverage pattern (VCP) that NWS forecasters utilize to help analyze the atmosphere around the radar. These different VCPs have varying numbers of elevation tilts and rotation speeds of the radar itself. Therefore, each VCP can provide a different perspective of the atmosphere. Once the radar sweeps through all elevation slices, a volume scan is complete. The WSR-88D radar can use several VCPs.
There are two main classes of VCPs, which are commonly referred to as Clear Air Mode and Precipitation Mode.
Clear Air Mode
In Clear Air Mode, the radar is in its most sensitive operation. The NWS uses Clear Air Mode when there is no rain within the range of the radar. This mode has the slowest antenna rotation rate, which permits the radar to sample the atmosphere longer. This slower sampling increases the radar’s sensitivity and ability to detect smaller objects in the atmosphere. The term “clear air” does not imply “no precipitation” mode. Even in Clear Air Mode, the WSR-88D can detect light, stratiform precipitation (e.g., snow) due to the increased sensitivity. Generally, the only returned energy to the radar will be very close to the radar’s location.
Many of the radar returns in Clear Air Mode are airborne dust and particulate matter. The WSR-88D images are updated approximately every 10 minutes when operating in this mode.
Precipitation Mode
Precipitation targets typically provide stronger return signals to the radar than nonprecipitation targets. Therefore, the WSR-88D is operated in Precipitation Mode when precipitation is present, although some nonprecipitation echoes can still be detected in this operating mode. The NWS uses Precipitation Mode to see higher into the atmosphere when precipitation is occurring to analyze the vertical structure of the storms.
The faster rotation of the WSR-88D in Precipitation Mode allows images to update at a faster rate, approximately every 4 to 6 minutes.
Echo Intensities
The colors on radar images represent the reflective power of the precipitation target. In general, the amount of radar power received is proportional to the intensity of the precipitation. This reflective power, commonly referred to by meteorologists as “reflectivity,” is measured in terms of dBZ. A decibel is a unit that describes the change of power emitted versus the power received. Since the power emitted is constant, the power received is related to the intensity of the precipitation target. Each reflectivity image includes a color scale that describes the relationship among reflectivity value, color on the radar image, and precipitation intensity (see Figure 24-11). The color scale and decibel scale can vary depending on the service provider and website. Reflectivity is correlated to intensity of precipitation. For example, in Precipitation Mode, when the decibel value reaches 15, light precipitation is present. The higher the indicated reflectivity value, the higher the rainfall rate. The interpretation of reflectivity values is the same for both Clear Air and Precipitation Modes.
Figure . Example WSR-88D (NEXRAD) Weather Radar Echo Intensity Legend
Reflectivity is also correlated with intensity terminology (phraseology) for ATC purposes. Table 24-8 defines this correlation.
Table . WSR-88D Weather Radar Precipitation Intensity Terminology
| Reflectivity (dBZ) Ranges | Weather Radar Echo Intensity Terminology |
| <30 dBZ | Light |
| 30–40 dBZ | Moderate |
| >40–50 dBZ | Heavy |
| 50+ dBZ | Extreme |
Note: En route ATC radar’s weather and radar processor (WARP) does not display light precipitation.
Values below 15 dBZ are typically associated with clouds. However, they may also be caused by atmospheric particulate matter such as dust, insects, pollen, or other phenomena. The scale cannot reliably be used to determine the intensity of snowfall. However, snowfall rates generally increase with increasing reflectivity.
Radar Products
The NWS produces many radar products that serve a variety of users. Some of these products are of interest to the aviation community. This section will discuss radar mosaics, Composite Reflectivity, Base Reflectivity, and Echo Tops products.
Radar Mosaic
A radar mosaic consists of multiple single-site radar images combined to produce a radar image on a regional or national scale. Regional and national mosaics can be found on the websites of the NWS, AWC, and all NWS WFOs, as well as commercial aviation weather providers. Radar mosaics can be assembled from Composite Reflectivity , Base Reflectivity , and Echo Tops , depending on the website or data provider.
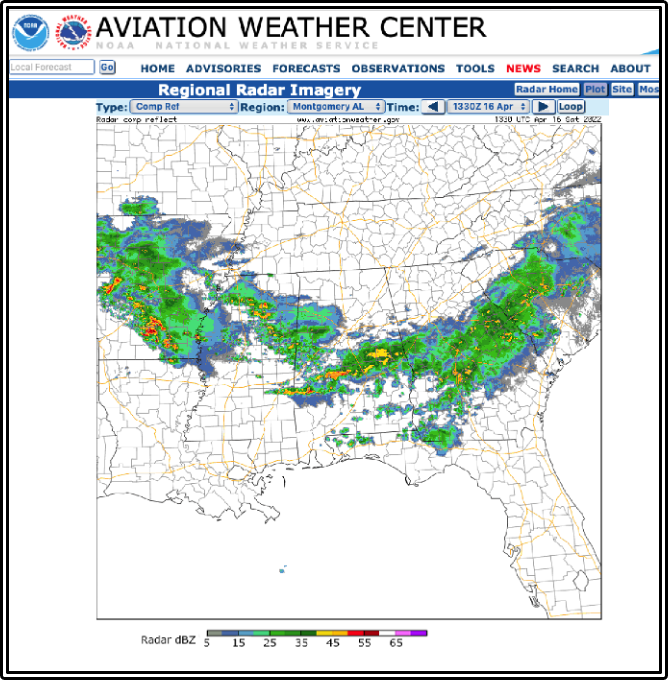
Figure . Regional Radar Mosaic Example Using Composite Reflectivity
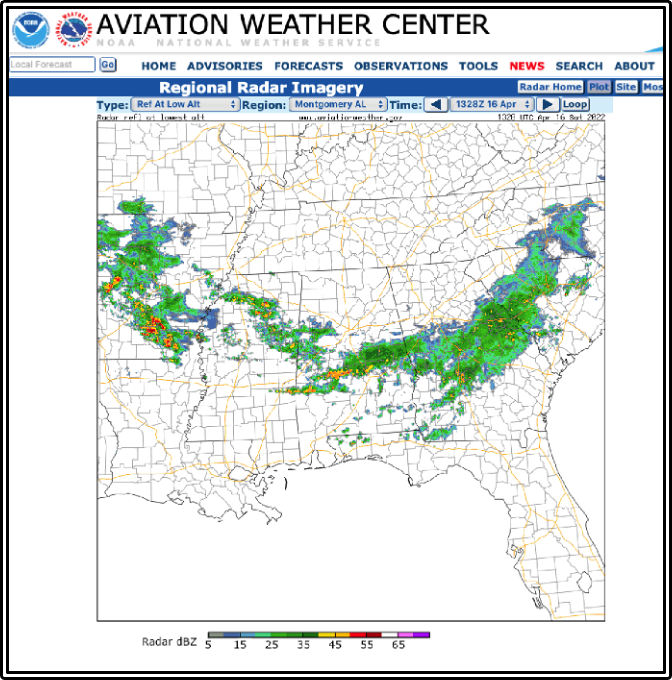
Figure . Regional Radar Mosaic Example Using Base Reflectivity (Reflectivity at Lowest Altitude)
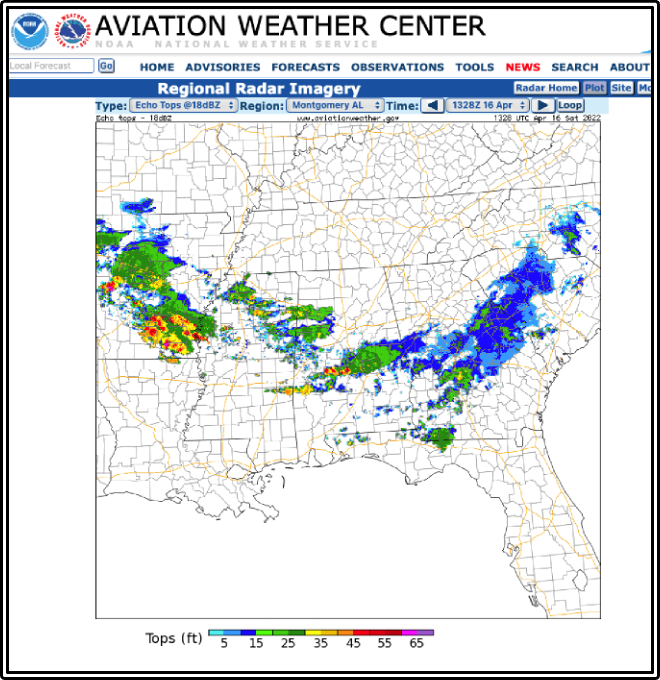
Figure . Regional Radar Mosaic Example Using Echo Tops (Tops of the 18 dBZ Radar Echo in Thousands of
Feet Above Sea Level)
Composite Reflectivity
Because the highest precipitation intensity can be at any altitude, the Composite Reflectivity product (see Figure 24-15) is needed. Composite Reflectivity is the maximum echo intensity (reflectivity) detected within a column of the atmosphere above a location. During its tilt sequence, the radar scans through all of the elevation slices to determine the highest decibel value in the vertical column (see Figure 24-16), then displays that value on the product. When compared with Base Reflectivity, the Composite Reflectivity can reveal important storm structure features and intensity trends of storms (see Figure 24-17). NEXRAD radar displays on airplane avionics use the Composite Reflectivity data for their radar mosaics.
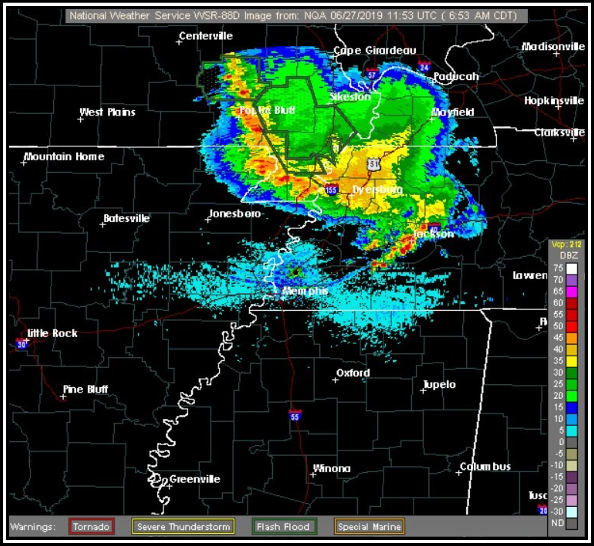
Figure . WSR-88D Weather Radar Composite Reflectivity, Single-Site Product Example
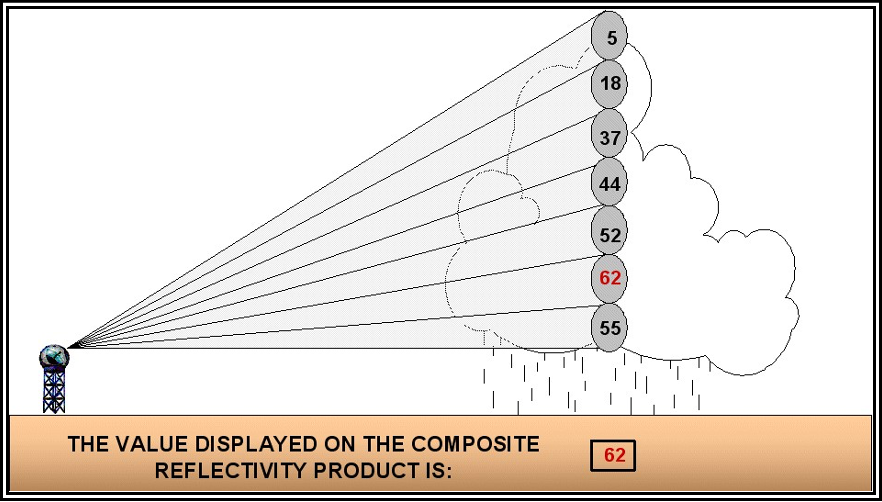
The Composite Reflectivity product displays the highest reflectivity of all elevation scans.
Figure Creation of a Composite Reflectivity, Single-Site Product
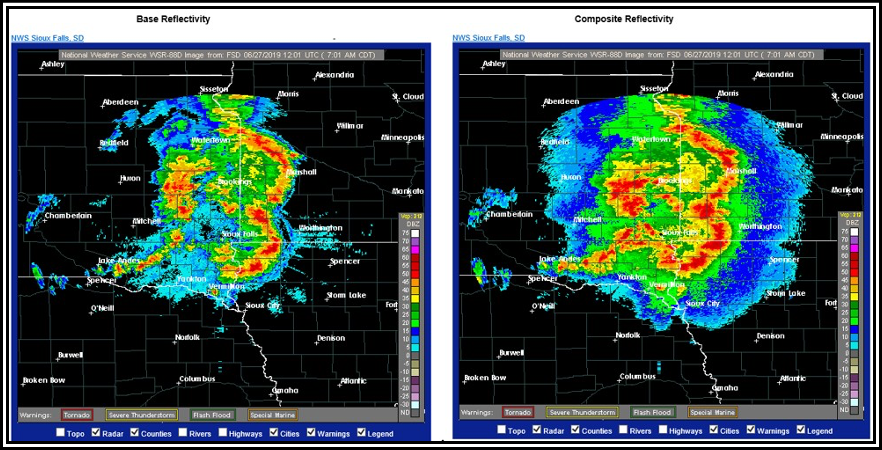
This Composite Reflectivity shows that in many locations the highest precipitation intensity occurs at an altitude higher than precipitation detected at the elevation of the base elevation angle.
Figure . Weather Radar 0.5º Base Reflectivity (left) versus Composite Reflectivity (right) Comparison
Base Reflectivity
The Base Reflectivity product is a display of both the location and intensity of reflectivity data from the lowest elevation angle scan, or 0.5º above the horizon. Base Reflectivity is also known as “Lowest Tilt” and “Reflectivity at Lowest Altitude,” depending on the website or weather data service provider.
The Base Reflectivity product is one elevation scan, whereas Composite Reflectivity looks at all elevation scans. Base Reflectivity products are available several minutes sooner than Composite Reflectivity products. Precipitation at any location may be heavier than depicted on the Base Reflectivity image because it is occurring above the lowest elevation angle.
Depending on the radar website or service provider, the range of the Base Reflectivity single-site radar product is either 124 NM or 248 NM. When using a single-site radar (i.e., not using a radar mosaic), echoes farther than 124 NM from the radar site might not be displayed, even if precipitation may be occurring at these greater distances.
Echo Tops
An Echo Tops product provides an estimation of the top of the precipitation by using the height of 18 dBZ radar echo above sea level (see Figure 24-18). Cloud tops will be higher than the top of the precipitation.
Radar Coded Message (RCM)
With the deployment of the WSR-88D (NEXRAD) radar network in the 1990s, the manual radar observations, known by the acronyms “ROB,” “SD,” and “RAREP,” were replaced by the RCM. The RCM is the encoded and transmitted report of radar features observed by a WSR-88D radar. The RCM is generated automatically and has no human input or oversight.
The actual RCM is highly detailed, complicated, and not intended for use by the pilot or operator in raw format. However, the RCM is used to generate certain radar charts or displays, such as the current “RCM Radar Plot,” available on the AWC’s website, as well as other weather service providers’ websites.
The RCM display is updated every 30 minutes. The display is an image representation of the NEXRAD radar Composite Reflectivity overlaid with cloud and echo tops and centroid movement. The RCM display includes the maximum echo top for each radar’s area of coverage. The other tops shown on the display are derived from the satellite images. The echo tops shown on the display can be erroneous in some cases. The algorithm computes echo tops (the altitude of echoes greater than or equal to 18 dBZ) within the range of the radar. This can lead to spurious values when precipitation is far from the site. Values greater than 50,000 ft (500 ft on the plot) can be disregarded, especially if their locations do not correspond to any precipitation.
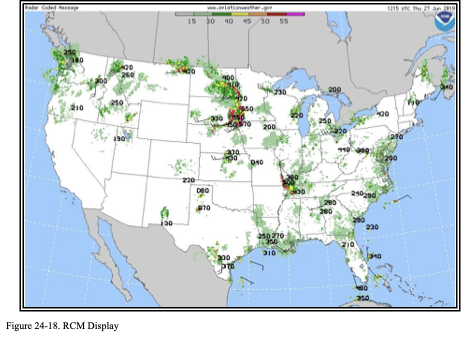
Limitations
Limitations associated with Composite Reflectivity and Base Reflectivity images include: • The radar beam may overshoot or undershoot targets (see Section 15.2.8); and
- The image may be contaminated by (see Sections 15.2.9 through 15.2.14):
- Beam blockage, o Ground clutter, o AP, o Ghosts,
- Angels, and/or o Other nonmeteorological phenomena.
Limitations associated with mosaics include:
- Datalinked mosaic radar imagery shows where the precipitation was, not where the precipitation is occurring. The displayed radar precipitation may be 15 to 20 minutes older than the age indicated on the display.
Terminal Doppler Weather Radar (TDWR)
The terminal Doppler weather radar (TDWR) is a Doppler weather radar system operated by the FAA, which is used primarily for the detection of hazardous wind shear conditions, precipitation, and winds aloft on and near major airports situated in climates with great exposure to thunderstorms.
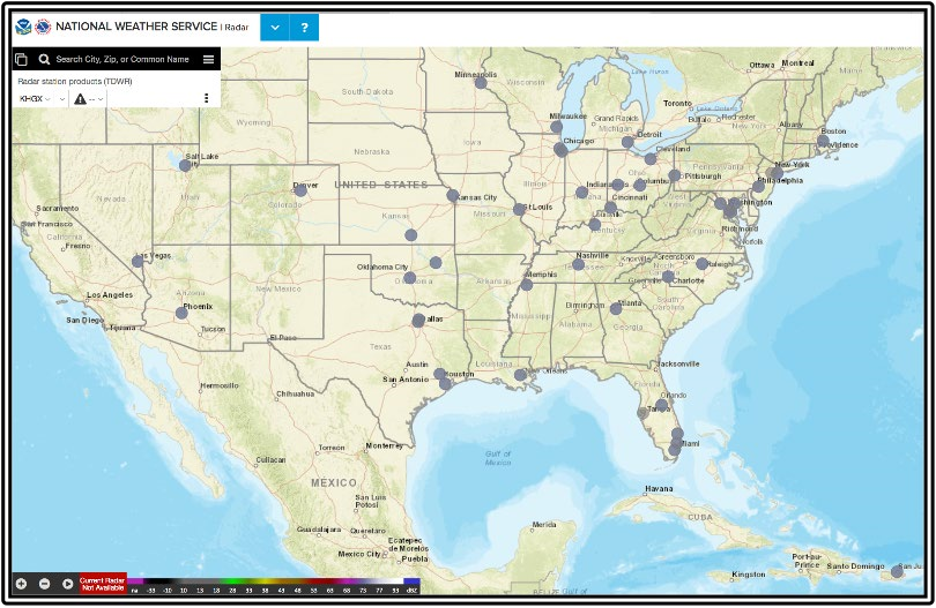
TWDR locations are indicated by gray circles.
Figure . TDWR Locations in the CONUS and Puerto Rico
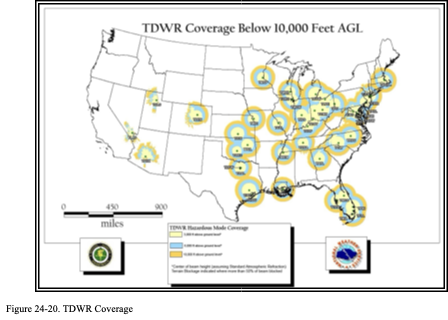
TDWR has long- and short-range scans as well as monitor and hazardous weather modes. Update times vary from around 5 minutes in monitor mode to 1 minute in hazardous weather mode. Select TDWR products are available on NWS radar websites.
Satellite Observations
Description
Satellite is perhaps the single most important source of weather data worldwide, particularly over data-sparse regions, such as countries without organized weather data collection and the oceans.
There are two kinds of weather satellite: geostationary and polar-orbiting. Geostationary satellites are located about 22,000 mi above the equator and orbit the Earth at a very fast speed that effectively makes them appear stationary. Polar-orbiting satellites orbit the Earth at a much lower altitude. Their track is such that the Earth rotates underneath the satellite as it orbits from the North Pole to the South Pole, then back to the North Pole.
The vast majority of weather satellite imagery for aviation comes from NOAA’s Geostationary Operational Environmental Satellites (GOES).
Imagery Types
Four types of satellite imagery are commonly used: GeoColor, visible, infrared (IR), and water vapor. Visible imagery is only useful during daylight hours. IR and water vapor imagery are useful day or night.
GeoColor Imagery GeoColor imagery is a multispectral product composed of true color (using a simulated green component) during the daytime, and an IR product at night. During the day, the imagery looks approximately as it would appear when viewed with human eyes from space. At night, the blue colors represent liquid water clouds such as fog and stratus, while gray to white indicate higher ice clouds, and the city lights come from a static database
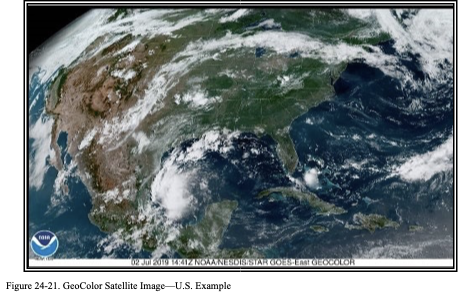
Visible Imagery
Visible imagery (see Figure 24-22) displays reflected sunlight from the Earth’s surface, clouds, and particulate matter in the atmosphere. Visible satellite images, which look like black and white photographs, are derived from the satellite signals. Clouds usually appear white, while land and water surfaces appear in shades of gray or black. The visible channel senses reflected solar radiation. Clouds, the Earth’s atmosphere, and the Earth’s surface all absorb and reflect incoming solar radiation. Since visible imagery is produced by reflected sunlight (radiation), it is only useful during daylight.
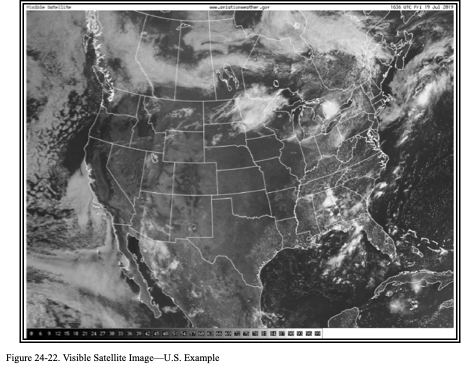
Visible Image Data Legend The data legend on a visible image displays albedo, or reflectance, expressed as a percentage . For example, an albedo of 72 means 72 percent of the sunlight that struck a feature was reflected back to space.

The gray shades (values) represent albedo, or reflectance, expressed as a percentage.
Figure . Visible Satellite Image Data Legend
Infrared (IR) Imagery
IR images (see Figure 24-24 and Figure 24-25) display temperatures of the Earth’s surface, clouds, and particulate matter. Generally speaking, the warmer an object, the more IR energy it emits. The satellite sensor measures this energy and calibrates it to temperature using a very simple physical relationship.
Clouds that are very high in the atmosphere are generally quite cold (e.g., -50 ºC), whereas clouds very near the Earth’s surface are generally quite warm (e.g., +5 ºC). Likewise, land may be even warmer than the lower clouds (e.g., +20 ºC). Those colder clouds emit much less IR energy than the warmer clouds, and the land emits more than those warm clouds.
The data measured by satellite is calibrated and colorized according to the temperature. If the temperature of the atmosphere decreases with height (which is typical), cloud-top temperature can be used to roughly determine which clouds are high-level and which are low-level.
When clouds are present, the temperature displayed on the IR images is that of the tops of clouds. When clouds are not present, the temperature is that of the ground or the ocean. A major advantage of the IR channel is that it can sense energy at night, so this imagery is available 24 hours a day.
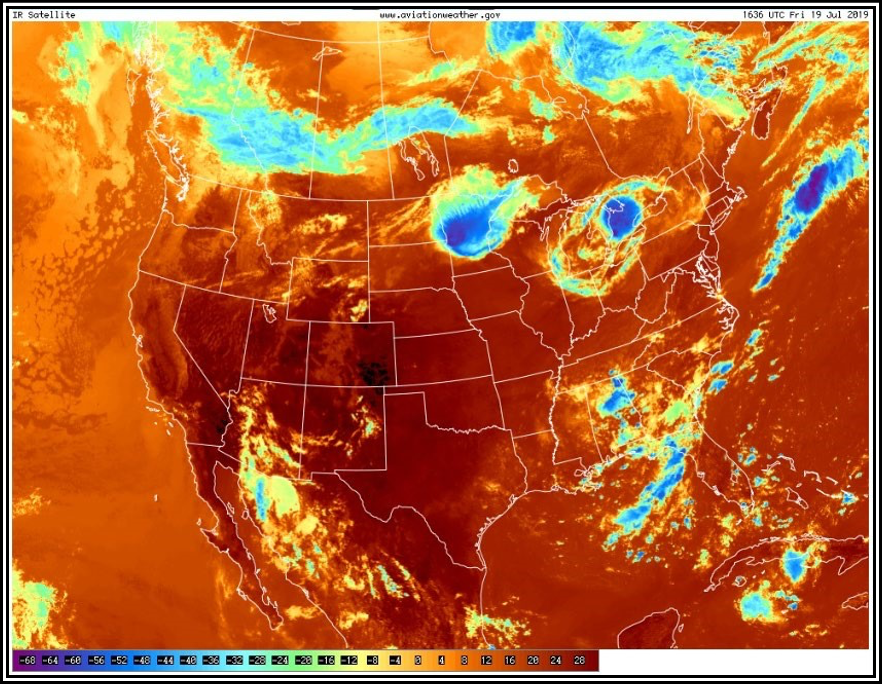
The scale is in degrees Celsius. Blue/purple colors indicate colder temperatures, while orange/red colors indicate warmer temperatures.
Figure . Infrared (Color) Satellite Image—U.S. Example
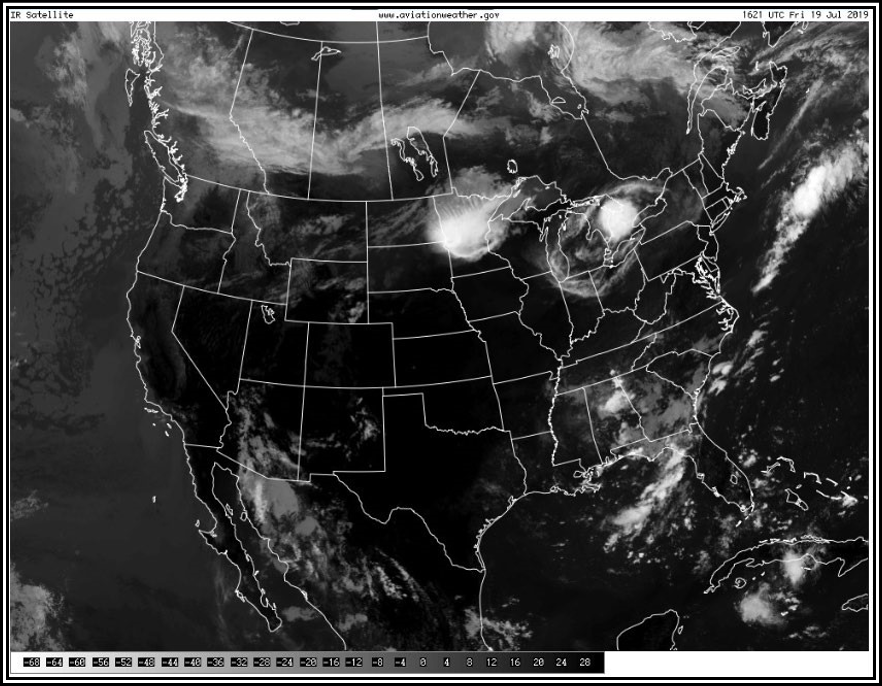
The scale is in degrees Celsius. Lighter gray shades indicate colder temperatures, while darker gray shades indicate warmer temperatures.
Figure . Unenhanced Infrared (Black and White) Satellite Image—U.S. Example
24.7.2.3.1 Infrared Image Data Legends The data legend on an IR image is calibrated to temperature expressed in degrees Celsius (see Figure 24-26 and Figure 24-27). The legend may vary based on the satellite image provider.

The colors (values) represent temperature in degrees Celsius. Figure 24-26. Infrared (Color) Satellite Image Data Legend

The gray shades (values) represent temperature in degrees Celsius.
Figure . Unenhanced Infrared (Black and White) Satellite Image Data Legend
Water Vapor Imagery
Water vapor imagery displays the quantity of water vapor generally located in the middle and upper troposphere within the layer between 700 mb (approximately 10,000 ft MSL) and 200 mb (approximately FL390). The actual numbers displayed on the water vapor images correspond to temperature in degrees Celsius. No direct relationship exists between these values and the temperatures of clouds, unlike IR imagery. Water vapor imagery does not really “see” clouds, but “sees” high-level water vapor instead. The most useful information to be gained from the water vapor images is the locations and movements of weather systems, jet streams, and thunderstorms. Another useful tidbit is aided by the color scale used on the images. In general, regions displayed in shades of red are very dry in the upper atmosphere and may correlate to crisp, blue skies from a ground perspective. On the contrary, regions displayed in shades of blue or green are indicative of a lot of high-level moisture and may also indicate cloudiness. This cloudiness could simply be high-level cirrus types or thunderstorms. That determination cannot be ascertained from this image by itself, but could easily be determined when used in conjunction with corresponding visible and IR satellite images. A major advantage of the water vapor channel is that it can sense energy at night, so this imagery is available 24 hours a day.
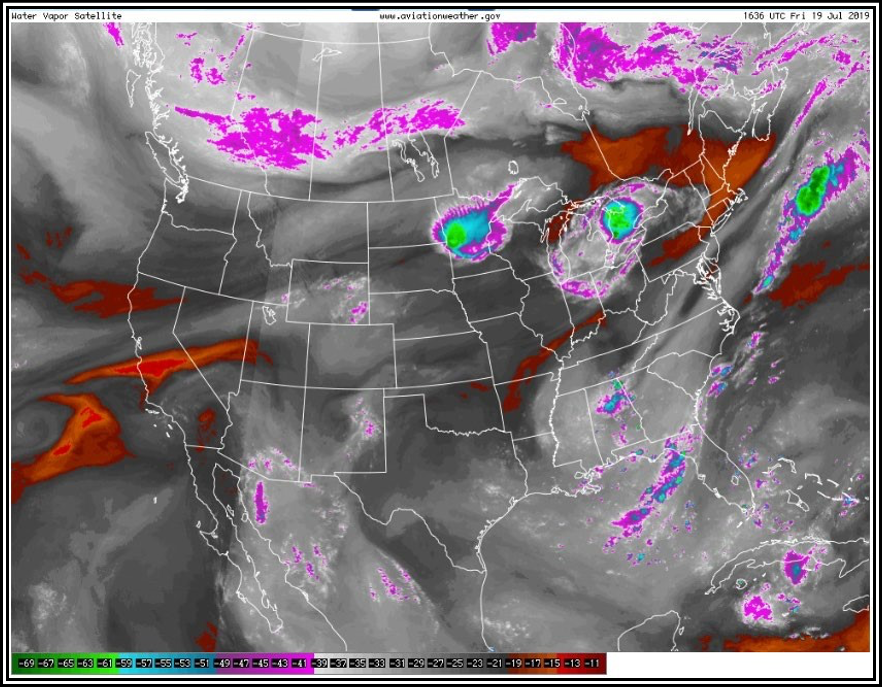
The scale is in degrees Celsius. Blue/green colors indicate moisture and/or clouds in the mid/upper troposphere, while dark gray/orange/red colors indicate dry air in the mid/upper troposphere.
Figure . Water Vapor Satellite Image—U.S. Example
Water Vapor Image Data Legend The data legend on water vapor images is calibrated to temperature expressed in degrees Celsius (see Figure 24-29). The actual data values on the water vapor images are not particularly useful. Interpretation of the patterns and how they change over time is more important. The legend may vary depending on the satellite image provider.

The colors (values) represent temperature in degrees Celsius.
Figure 24-29. Water Vapor Satellite Image Data Legend
Polar Operational Environment Satellites (POES)
“POES” stands for the Polar Operational Environment Satellites. Polar satellites are not stationary. They track along various orbits around the poles. Typically, they are somewhere between 124 and 1,240 mi above the Earth’s surface. The satellites scan the Earth in swaths as they pass by on their tracks.
The NWS AAWU posts POES images on their website.
Benefits
Because polar satellites are so much closer to Earth, you can get very high resolution (i.e., better than 0.5 km (or about 5/8 mi)). This allows for weather and surface features to be seen in much greater detail.
This is particularly useful over the poles and arctic areas. The quality of geostationary satellite data degrades the closer you get to the poles, while polar satellite data provides high resolution in those areas.
Shortfalls
By far the most significant shortfall is the latency, or the time between the satellite scanning the area and the time that the data is available to a user. Because polar satellites are moving, they cannot continuously transmit to a single station. Instead, there is a series of stations around the globe through which the data is collected. Data is then transmitted from those stations to other locations. At times, it can be several hours old (or more) by the time it reaches operational users in the United States (in polar areas it is much quicker). There are some direct ground stations closer to the United States, which can cut the latency to about 45 minutes when utilizing the newer polar satellites.
Upper Air Observations
Radiosonde Observations (Weather Balloon)
Since the late 1930s, the NWS has taken routine scheduled upper air observations with radiosondes attached to weather balloons, usually referred to as soundings. Weather data from the radiosondes are foundational to all computer model forecasts produced by the NWS and others.
The radiosonde is a small, expendable instrument package (weighing 100 to 500 g), which consists of radio gear and sensing elements, that is suspended below a large balloon inflated with hydrogen or helium gas (see Figure 24-30). As the radiosonde rises at about 300 m per minute (about 1,000 ft per minute), sensors on the radiosonde measure profiles of pressure, temperature, and moisture. These sensors are linked to a battery-powered radio transmitter that sends the sensor measurements to a ground tracking antenna. Wind speed and direction aloft are also obtained by tracking the position of the radiosonde in flight using the GPS. Most stations around the world take rawinsonde observations. However, meteorologists and other data users frequently refer to a rawinsonde observation as a radiosonde observation.
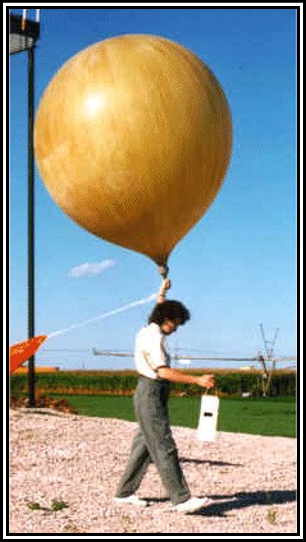
Figure Weather Balloon and Radiosonde
Issuance Weather balloons with radiosondes are launched twice a day worldwide from designated locations at around 1100 UTC and 2300 UTC . It takes approximately 90 minutes for the balloon to reach an altitude of 100,000 ft. The weather data collected is assigned the observation times of 1200 UTC and 0000 UTC. Special radiosondes may be launched at select times for various reasons, including when severe weather is expected in a region.
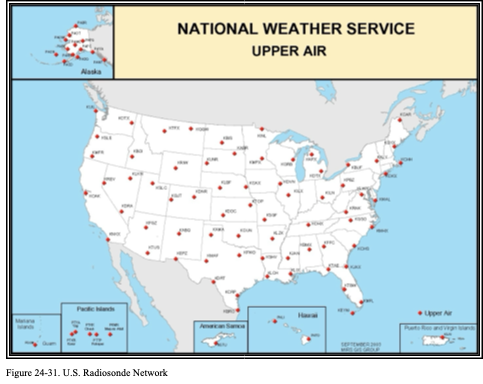
Aviation Weather Cameras
FAA Aviation Weather Camera Network
In July 2007 the FAA, under the leadership of Walter Combs, began a program to assist Alaska pilots with their significant needs for weather information. Combs’ passion for safe flight in Alaska provided the fuel for much improved situational awareness, seeing the weather picture in mountain passes. His work, along with management support, created the Aviation Weather Camera Network.
Flight Service delivers the FAA’s Aviation Weather Camera Network (see Figure 24-32 and Figure 24-33), which consists of nearly 500 camera facilities in remote or mountainous locations. Additional sites will be added to the network as they are installed and become operational. Each site has up to four cameras. The direction of each camera (see Figure 24-34) is provided with reference to a Sectional Chart. A “clear day” image (see Figure 24-35) is provided for reference and comparison to the latest image (. In Alaska, locations with cameras are marked on Sectional Charts and listed in Chart Supplement Alaska, Section 2, Airport/Facility Directory, as well as under Section 4, Associated Data, FAA Aviation Camera Locations.
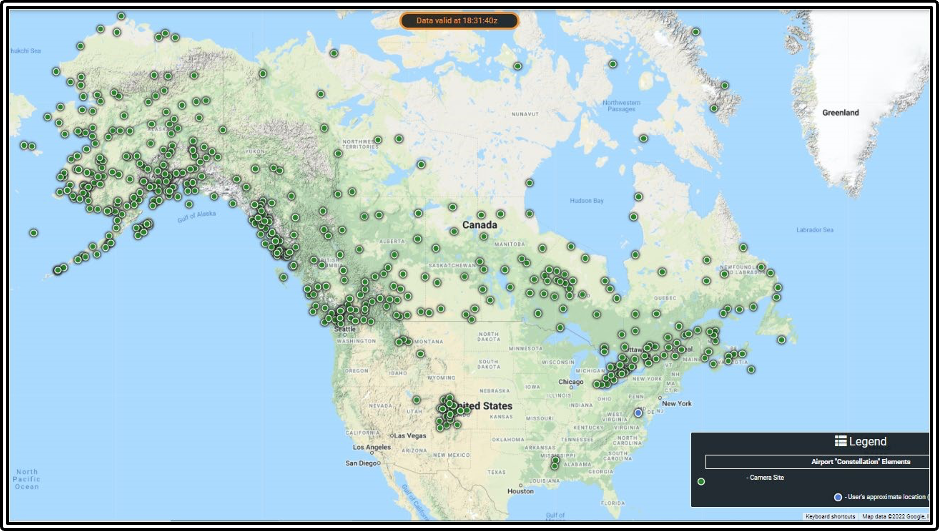
Figure . Map of FAA’s Aviation Weather Camera Network in Alaska, the CONUS, and Canada
Figure . Map of the FAA’s Aviation Weather Camera Network in Hawaii
Canadian camera sites are owned and operated by NAV CANADA, Canada’s civilian air navigation service provider
Figure . Sectional Chart Depicting Hyder (4Z7), Alaska Camera Orientations
Figure . “Clear Day” Image from the Aviation Weather Camera at Hyder (4Z7), Alaska
Figure . Aviation Weather Camera Image at Hyder (4Z7), Alaska
Visibility Estimation through Image Analytics (VEIA)
VEIA, which is available on the FAA’s Aviation Weather Camera Network, is an algorithm that uses the FAA’s Aviation Weather Camera Network to produce visibility estimates (in statute miles) by analyzing the views in the camera imagery. VEIA uses all of the cameras at a single site to produce one prevailing visibility estimate for that location by identifying and measuring the strength of the edges of permanent features in the landscape/scene and comparing them to a clear day reference. VEIA visibility estimates allow users to quickly access visibility estimates at the departure location, along the route, and at the destination between sunrise and sunset (not during twilight hours or at night). VEIA visibility estimates are supplemental information, for use with other meteorological information, displayed in conjunction with the specific site’s camera images. The visibility estimates are accessible on the FAA’s Aviation Weather Camera website. See Figure 24-37 for an example VEIA visibility estimate.
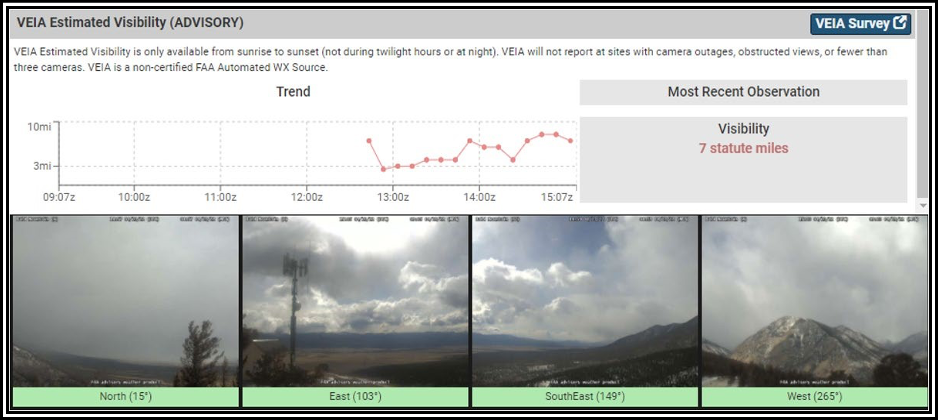
Figure . VEIA Example at Bald Mountain (K7BM) in Colorado
Visual Weather Observation System (VWOS)
VWOS, which is available on the FAA’s Aviation Weather Camera Network, is an advanced camera system that is comprised of a suite of weather sensors and 360-degree camera images that collectively observe and report several critical data fields, including winds, cloud height, visibility, present weather, temperature, dewpoint, and pressure. VWOS uses automated processes to self-check and validate its operations and data outputs. It provides operators with visual and textual weather observations as guidance, for use with other weather information, to make flight decisions into airports that do not possess an AWOS/METAR.
In the future, VEIA will be a core component of VWOS.
Issuance
Camera images are available on the FAA’s Aviation Weather Camera website, which can be found in Appendix A. Images are generally updated every 10 minutes. The time of the last update is indicated on each image. Actual site conditions may differ from displayed images due to a variety of reasons (e.g., rapidly changing weather conditions, image update frequency, or optical distortion).
Camera images are to be used to improve situational awareness. They are not to be used to determine weather minimums for VFR or IFR flight, unless authorized by the Administrator of the FAA. In addition to the camera images, the website also delivers a variety of safety of flight information, including adverse conditions (e.g., AIRMETs and SIGMETs), current conditions (e.g., METARs, radar, satellite imagery, and weather trends (see Figure 24-38), TAFs, PIREPs, and other aeronautical information (e.g., RCOs, TFRs, and charts).Figure 24-37. VEIA Example at Bald Mountain (K7BM) in Colorado
Visual Weather Observation System (VWOS)
VWOS, which is available on the FAA’s Aviation Weather Camera Network, is an advanced camera system that is comprised of a suite of weather sensors and 360-degree camera images that collectively observe and report several critical data fields, including winds, cloud height, visibility, present weather, temperature, dewpoint, and pressure. VWOS uses automated processes to self-check and validate its operations and data outputs. It provides operators with visual and textual weather observations as guidance, for use with other weather information, to make flight decisions into airports that do not possess an AWOS/METAR.
In the future, VEIA will be a core component of VWOS.
Issuance
Camera images are available on the FAA’s Aviation Weather Camera website, which can be found in Appendix A. Images are generally updated every 10 minutes. The time of the last update is indicated on each image. Actual site conditions may differ from displayed images due to a variety of reasons (e.g., rapidly changing weather conditions, image update frequency, or optical distortion).
Camera images are to be used to improve situational awareness. They are not to be used to determine weather minimums for VFR or IFR flight, unless authorized by the Administrator of the FAA. In addition to the camera images, the website also delivers a variety of safety of flight information, including adverse conditions (e.g., AIRMETs and SIGMETs), current conditions (e.g., METARs, radar, satellite imagery, and weather trends (see Figure 24-38), TAFs, PIREPs, and other aeronautical information (e.g., RCOs, TFRs, and charts).
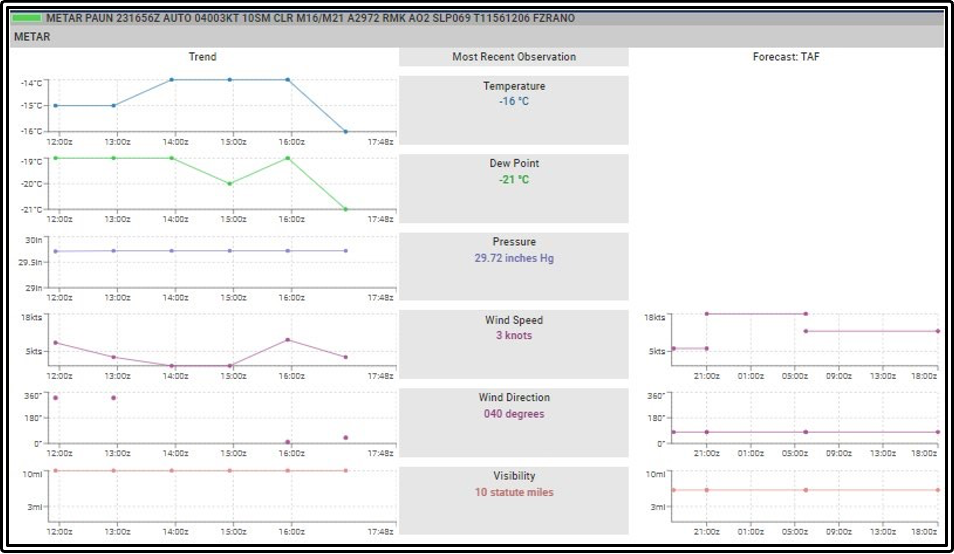
Figure .Weather Trends Example at Unalakleet (PAUN), Alaska.


