Introduction
The most effective tool to detect precipitation is radar. Radar, which is an acronym that stands for “radio detection and ranging,” has been utilized to detect precipitation since the 1940s. Radar enhancements have enabled more precision in detecting and displaying precipitation.
Principles of Weather Radar
The radar used by the NWS is called the Weather Surveillance Radar—1988 Doppler (WSR-88D). The prototype radar was built in 1988.
It is essential to understand some principles of weather radar. This will allow correct interpretation of WSR-88D images. This chapter will also include a comparison between some WSR-88D principles and aircraft radar principles. These comparisons will help explain the strengths and limitations of the WSR-88D and aircraft radar.
Antenna
The antenna alternately emits and receives radio waves into the atmosphere. Pulses of energy from the radio waves may strike a target. If they do, part of that energy will return to the antenna.
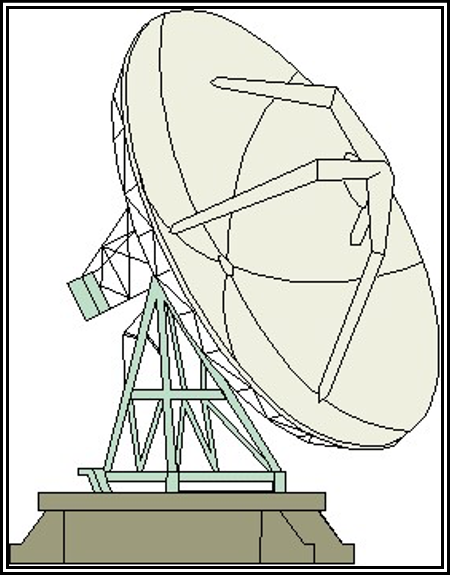
Figure . Radar Antenna
The shape of an antenna determines the shape of a beam. The WSR-88D has a parabolic-shaped antenna. This focuses the radio waves into a narrow, coned-shaped beam. The antenna can be tilted to scan many altitudes of the atmosphere.
Backscattered Energy
The amount of energy returned directly back to the radar after striking a target is called backscattered energy.
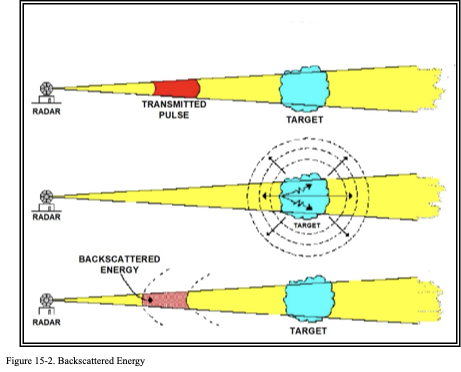
Targets may include precipitation, clouds, dust, birds, insects, buildings, air mass boundaries, terrain features, wind farms/turbines, etc. Reflectivity is a measurement of the amount of backscattered energy. An echo is the appearance, on a radar display, of the backscattered energy (i.e., reflectivity).
Power Output
The WSR-88D has a peak power output of 750 kilowatts (kW). This allows for better detection of low reflectivity (small) targets in the atmosphere, such as clouds, dust, insects, etc.
Most aircraft radars have a peak power output of less than 50 kW. Therefore, smaller targets are difficult to detect with aircraft radar.
Wavelengths
The wavelength is the distance between two crests or two troughs within the radio wave emitted from the radar (see Figure 15-3). The WSR-88D has a wavelength of 10 cm. Most aircraft radars have a wavelength of 3 cm. Although shorter wavelengths are better at detecting smaller targets, they are significantly more attenuated than longer wavelengths.

Figure . Wavelengths
Attenuation
Attenuation is any process that reduces energy within the radar beam. This reduces the amount of backscattered energy.
Precipitation Attenuation
Precipitation attenuation is the decrease of the intensity of energy within the radar beam due to absorption or scattering of the energy from precipitation particles.
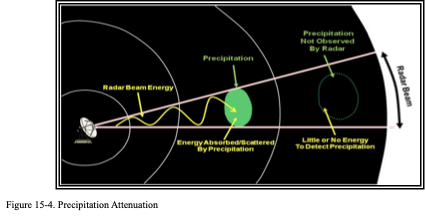
Precipitation close to the radar absorbs and scatters energy within the radar beam. Therefore, very little, if any, energy will reach targets beyond the initial area of precipitation. Because of precipitation attenuation, distant targets (i.e., precipitation) may not be displayed on a radar image. The amount of precipitation attenuation is related to the wavelength of the radar.
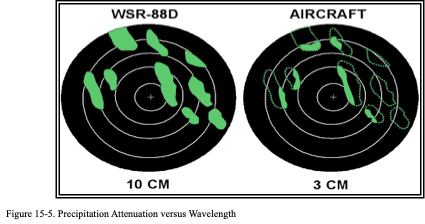
As the wavelength of the radar decreases, the amount of precipitation attenuation increases.
The WSR-88D’s 10-cm wavelength is not significantly attenuated by precipitation. However, aircraft radars, which typically have 3-cm wavelengths, have a significant precipitation attenuation problem. As a result, aircraft weather radar typically only shows the leading edge of extreme intensity echoes.
Range Attenuation
Range attenuation is the decrease of the intensity of energy within the radar beam as the beam gets farther away from the antenna. If not compensated for, a target that is farther away from the radar will appear less intense than an identical target closer to the radar.
Range attenuation is automatically compensated for by the WSR-88D. However, most airborne radars only compensate for range attenuation out to a distance of 50 to 75 NM. Targets beyond these ranges will appear less intense than they actually are.
Resolution
Resolution is the ability of the radar to show targets separately.
Beam Resolution
Beam resolution is the ability of the radar to identify targets separately at the same range, but different azimuths
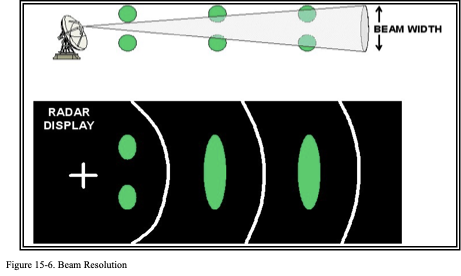
Two targets must be separated by at least one beam width (diameter) in order to be displayed as two separate echoes on a radar image.
The WSR-88D has a beam width of 0.95°. Therefore, at a range of 60 NM, targets separated by at least 1 NM will be displayed separately. At a range of 120 NM, targets separated by at least 2 NM will be displayed separately.
Aircraft radars have beam widths that vary between 3° and 10°. Assuming an average beam width of 5° at a range of 60 NM, targets separated by at least 5.5 NM will be displayed separately. At a range of 120 NM, targets separated by at least 10 NM will be displayed separately. The beam resolution is better for the WSR-88D than aircraft radar .
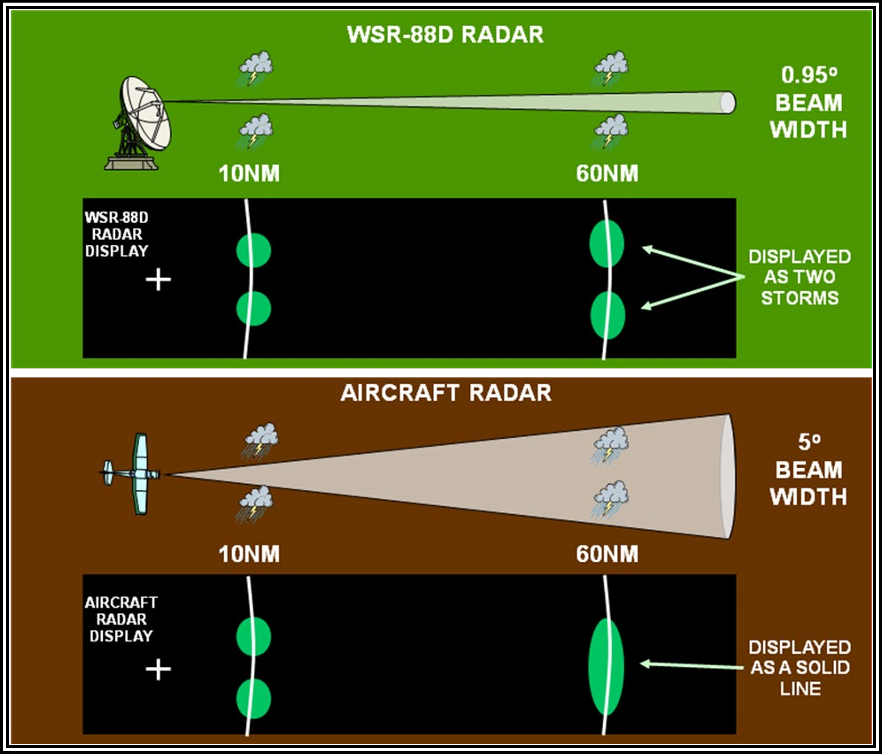
Figure . Beam Resolution Comparison between WSR-88D and Aircraft Weather Radar
In the example above, the targets (thunderstorms) are at the same range in azimuths for both the aircraft and WSR-88D radar. At 10 NM, the beam width is small enough for both the WSR-88D and aircraft radar to display the thunderstorms separately. At 60 NM, the WSR-88D beam width is still small enough to display both thunderstorms separately. However, the aircraft radar beam width is larger, which results in the two thunderstorms being displayed as one echo.
Note that the beam becomes wider at greater distances from the radar. Therefore, the beam resolution decreases with increasing range from the radar. As a result, lines of precipitation may appear to break up as they move closer to the radar. In reality, the breaks in the precipitation were most likely always there.
Wave Propagation
Radar beams do not travel in a straight line. The beam is bent due to differences in atmospheric density. These density differences, caused by variations in temperature, moisture, and pressure, occur in both the vertical and horizontal directions, and affect the speed and direction of the radar beam. In a denser atmosphere, the beam travels slower. Conversely, in the less dense atmosphere, the beam travels faster. Changes in density can occur over very small distances, so it is common for the beam to be in areas of different densities at the same time as it gets larger. The beam will bend in the direction of the slower portion of the wave.
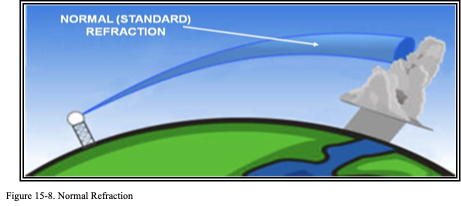
Normal (Standard) Refraction
Under normal (i.e., standard) conditions, the atmosphere’s density gradually decreases with increasing height. As a result, the upper portion of a radar beam travels faster than the lower portion of the beam. This causes the beam to bend downward . The radar beam curvature is less than the curvature of the Earth. Therefore, the height of the radar beam above the Earth’s surface increases with an increasing range.
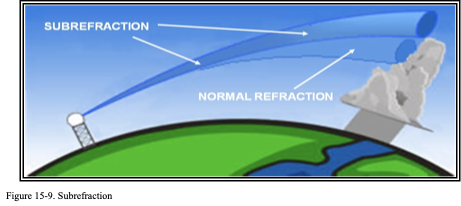
Subrefraction
Atmospheric conditions are never normal or standard. Sometimes, the density of the atmosphere decreases with height at a more-than-normal rate (actual density is less than normal). When this occurs, the radar beam bends less than normal and climbs skyward.This phenomenon is known as subrefraction . Subrefraction may cause the radar beam to overshoot objects that would normally be detected. For example, distant thunderstorms may not be detected with subrefraction. Subrefraction may also cause radar to underestimate the true strength of a thunderstorm. Thunderstorms may appear weaker on radar because subrefraction causes the radar beam to strike the thunderstorm near the top of the cumulonimbus cloud, where the precipitation particles tend to be smaller.
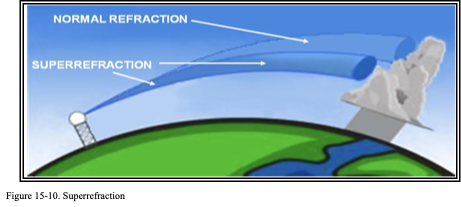
Superrefraction
Conversely, sometimes the density of the atmosphere decreases with height at a less-than-normal rate (actual density is greater than normal) or even increases with height. When this occurs, the radar beam will bend more than normal toward the Earth’s surface. This phenomenon is called superrefraction (see Figure 15-10). Superrefraction causes the radar beam to travel closer to the Earth’s surface than what would occur in a normal atmosphere. This can lead to overestimating the strength of a thunderstorm, as the beam would detect the stronger core of the storm, where precipitation-sized particles are larger.
Radar Beam Overshooting and Undershooting
Radar beam overshooting may occur because the lowest radar beam can be higher than the top of precipitation. This will most likely occur with stratiform precipitation and low-topped convection. For example, at a distance of 124 NM from the radar, the lowest radar beam is at an altitude of approximately 18,000 ft; at 248 NM the beam height is approximately 54,000 ft. Any precipitation with tops below these altitudes and distances will not be displayed on a single-site radar image. Therefore, it is quite possible that precipitation may be occurring where none appears on the single-site radar image.
Radar overshooting occurs more often in the mountainous western United States where some radars are located on a mountaintop (e.g., the WSR-88D near Cedar City, UT).
Radar undershooting occurs when precipitation occurs above the lowest radar beam, usually with high-cloud-based precipitation near the radar site. This often occurs in the western United States during the summer months. Undershooting may occur at and near the radar site even in mosaic products when the precipitation is above the highest elevation angle. This region above the radar is known as the “cone of silence”.
Figure . Cone of Silence
Beam Blockage
Beam blockage occurs when the radar beam is blocked by terrain and is particularly predominant in mountainous terrain.
Beam blockage is most easily seen on the lowest radar beam (also known as “Base Reflectivity,” “Lowest Tilt,” and “Reflectivity at Lowest Altitude”) images where it appears as a pie-shaped area (or areas) perpetually void of echoes. When animating the imagery, the beam blockage area will remain clear of echoes even as precipitation and other targets pass through. In many cases, the beam blockage effect seen on a single-site radar can be minimized by viewing mosaic images
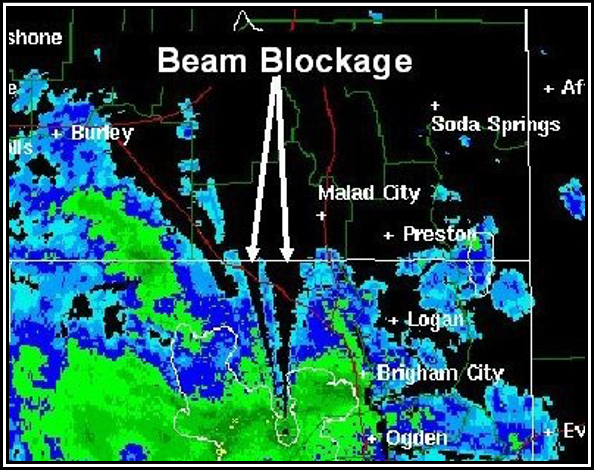
Figure . WSR-88D Weather Radar Beam Blockage on Base Reflectivity Product Example
Ground Clutter
Ground clutter is radar echoes’ returns from trees, buildings, or other objects on the ground. It appears as a roughly circular region of high reflectivity at ranges close to the radar. Ground clutter appears stationary when animating images and can mask precipitation located near the radar. Most ground clutter is automatically removed from WSR-88D imagery, so typically it is does not interfere with image interpretation.
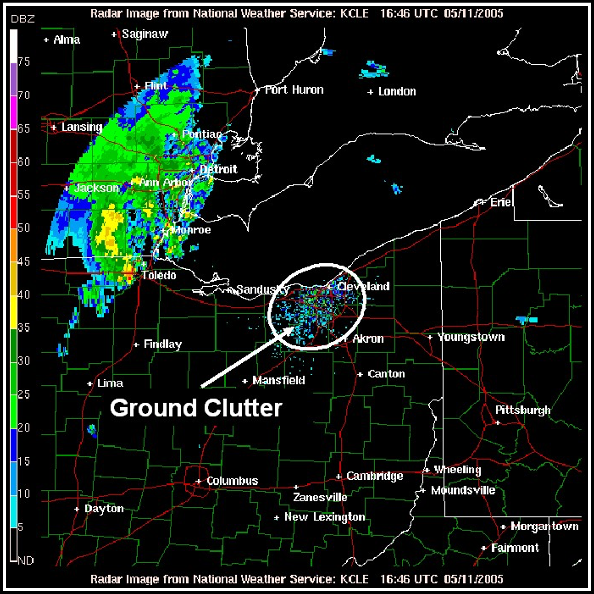
Figure . WSR-88D Weather Radar Ground Clutter Example
Ghost
A ghost is a diffused echo in apparently clear air caused by a “cloud” of point targets, such as insects, or by refraction returns of the radar beam in truly clear air.
The latter case commonly develops at sunset due to superrefraction during the warm season. The ghost develops as an area of low reflectivity echoes (typically less than 15 decibels of Z (dBZ)) near the radar site and quickly expands. When animating the imagery, the ghost echo shows little movement.
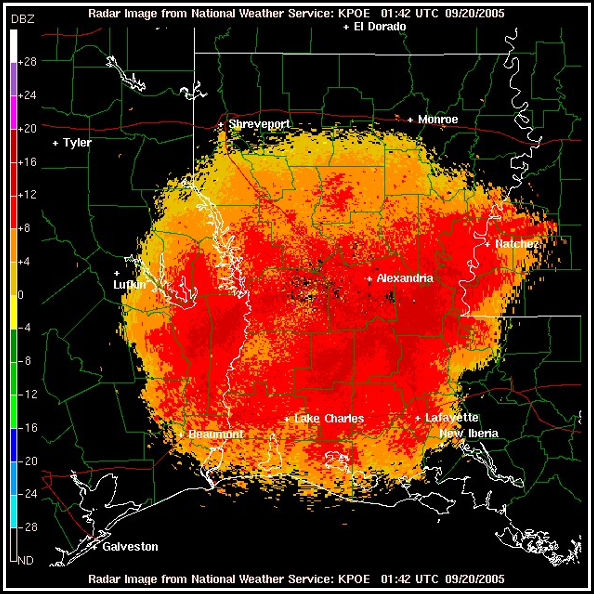
Figure WSR-88D Weather Radar Ghost Example
Angels
Angels are echoes caused by a physical phenomenon not discernible by the eye at the radar site. They are usually caused by bats, birds, or insects. Angels typically appear as a donut-shaped echo with low reflectivity values . When animated, the echo expands and becomes more diffuse with time. Angels typically only appear when the WSR-88D radar is in Clear Air Mode because of their weak reflectivity . Echoes caused by birds are typically detected in the morning when they take flight for the day. Echoes caused by bats are typically detected in the evening when they are departing from caves.
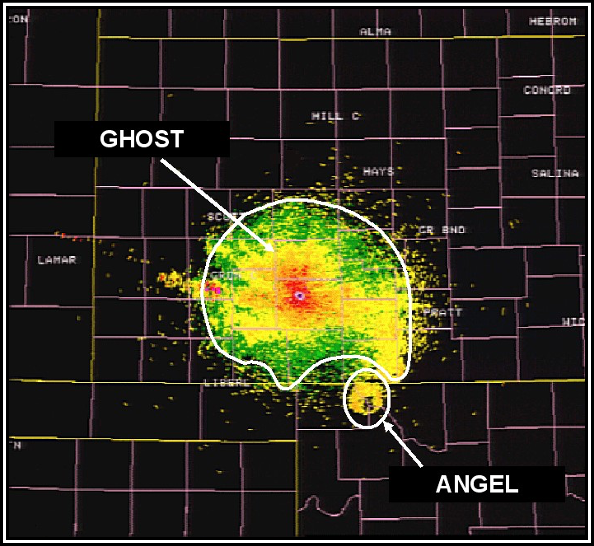
This angel was caused by bats departing Selman Bat Cave at Alabaster Caverns State Park, OK, around sunset.
Figure . WSR-88D Weather Radar Angel Example
Anomalous Propagation (AP)
AP is an extended pattern of ground echoes caused by superrefraction of the radar beam. Superrefraction causes the radar beam to bend downward and strike the ground. It differs from ground clutter because it can occur anywhere within the radar’s range, not just at ranges close to the radar. AP typically appears as speckled or blotchy high-reflectivity echoes. When animating images, AP tends to “bloom up” and dissipate, and has no continuity of motion. AP can sometimes be misinterpreted as thunderstorms; differentiating between the two is determined by animating the images. Thunderstorms move with a smooth, continuous motion while AP appears to “bloom up” and dissipate randomly.
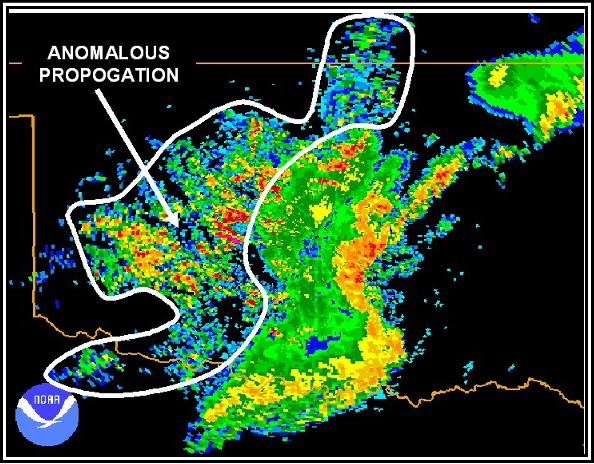
Figure . WSR-88D Weather Radar AP Example
Other Nonmeteorological Phenomena
Wind Farms
Wind farms can affect the return signal of the radar beam. Depending on the proximity of the wind farm to the radar site (generally within 10 NM), wind farm turbines can result in beam blockage, false echoes, or high reflectivity values.
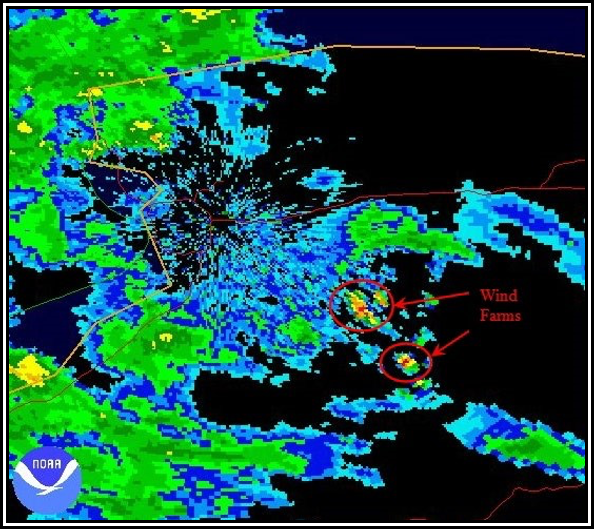
Figure . Wind Farms Can Make Benign Echoes Appear as Small Storms
Precipitation
Intensity of Precipitation
The intensity of precipitation is determined from the amount of energy backscattered by precipitation, also known as reflectivity. Reflectivity is determined by:
- The size of precipitation particles;
- The precipitation state (liquid or solid);
- The concentration of precipitation (particles per volume); and
- The shape of the precipitation.
Intensity of Liquid Precipitation
The most significant factor in determining the reflectivity of liquid particles is the size of the precipitation particle.
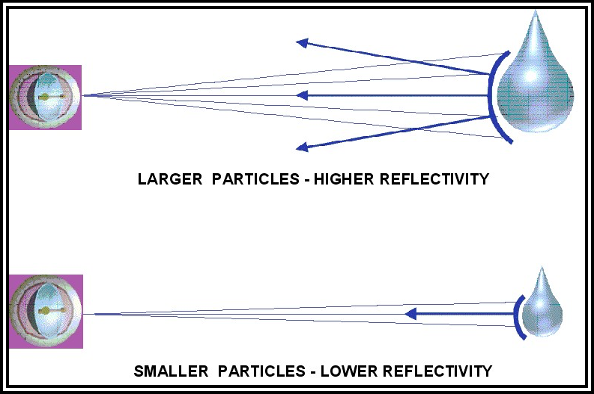
Figure 15-19. Reflectivity Associated with Liquid Targets
Larger particles have greater reflectivity than smaller particles. For example, a particle with a 1/4-in diameter backscatters the same amount of energy as 64 particles that each have a 1/8-in diameter.
Radar images/intensity scales are associated with reflectivities that are measured in dBZ. The dBZ values increase based on the strength of the return signal from targets in the atmosphere.
Typically, liquid precipitation-sized particle reflectivities are associated with values that are 15 dBZ or greater. Values less than 15 dBZ are typically associated with liquid cloud-sized particles. However, these lower values can also be associated with dust, pollen, insects, or other small particles in the atmosphere.
Convective Precipitation
Convective precipitation is distinguished by the following radar characteristics:
- Echoes tend to form as lines or cells;
- Reflectivity gradients are strong;
- Precipitation intensities generally vary from moderate to extreme;
- Occasionally, precipitation intensities can be light; and
- Echo patterns change rapidly when animating the image.
Numerous hazards are associated with convective precipitation. These hazards include: turbulence, Low-Level Wind Shear (LLWS), strong and gusty surface winds, icing above the freezing level, hail, lightning, tornadoes, and localized IFR conditions below the cloud base due to heavy precipitation.
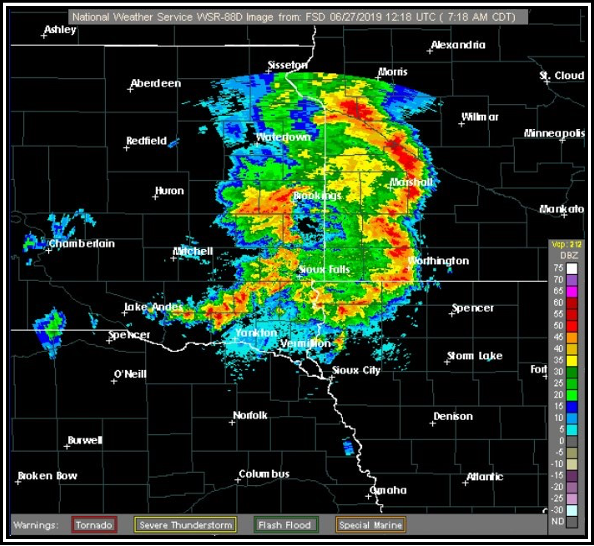
Figure 15-20. WSR-88D Weather Radar Convective Precipitation on the 0.5º Base Reflectivity Product Example
Stratiform Precipitation
Stratiform precipitation has the following radar characteristics:
- Widespread in aerial coverage;
- Weak reflectivity gradients;
- Precipitation intensities are generally light or moderate (39 dBZ or less);
- Occasionally, precipitation intensities can be stronger; and
Echo patterns change slowly when animating the image
Hazards associated with stratiform precipitation include possible widespread icing above the freezing level, low ceilings, and reduced visibilities.
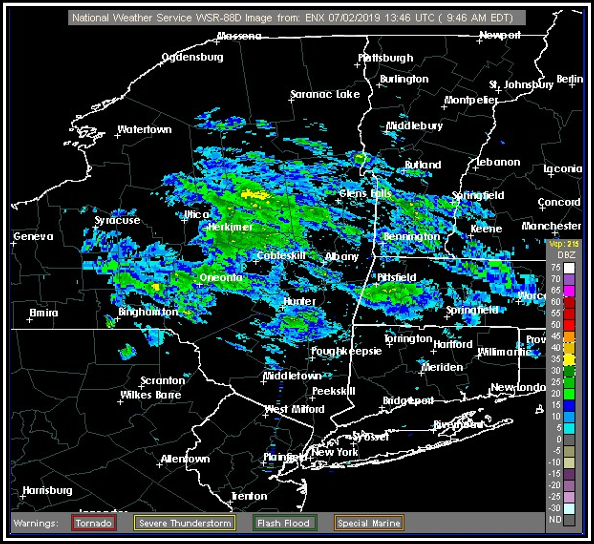
Figure. WSR-88D Weather Radar Stratiform Precipitation on the 0.5º Base Reflectivity Product Example
Intensity of Snow
A radar image cannot reliably be used to determine the intensity of snowfall. However, snowfall rates generally increase with increasing reflectivity.
Bright Band
Bright band is a distinct feature observed by radar that denotes the freezing (melting) level. The term originates from a band of enhanced reflectivity that can result when a radar antenna scans through precipitation. The freezing level in a cloud contains ice particles that are coated with liquid water. These particles reflect significantly more energy (appearing to the radar as large raindrops) than the portions of the cloud above and below the freezing layer.


