Introduction
Weather is the state of the atmosphere at a given time and place, with respect to temperature, moisture content, turbulence, and cloudiness. These factors interact to form the following five major meteorological elements:
- Atmospheric pressure (high or low),
- Air temperature (heat or cold),
- Wind (calm or storm),
- Clouds (clearness or cloudiness), and
- Precipitation (rain, sleet, snow).
A solid understanding of weather theory provides the tools necessary to understand the reports and forecasts obtained from a Flight Service Station (FSS) weather specialist and other aviation weather services. No other means of aviation relies more heavily on knowledge and understanding of weather for its safety than ballooning. It is important to note, however, that there is no substitute for experience.
There are many excellent texts and online sources available for learning more about weather that are referenced at the appropriate point in this chapter. Much of the following information can be found in the Federal Aviation Administration (FAA) Advisory Circular (AC) 00-06A, Aviation Weather For Pilots and Flight Operations Personnel, and AC 00-45E, Aviation Weather Services, both of which may be found at the FAA’s Regulatory and Guidance Library (RGL) located online at rgl.faa.gov.
Other online sources for weather information are also helpful. The National Oceanic and Atmospheric Administration (NOAA) offers a weather tutorial at www.srh.noaa.gov/srh/ jetstream/. Developed to meet the needs of educators, weather professionals, and others interested in learning more about weather, it provides a number of concise explanations of weather theory. Additionally, ww2010.atmos.uiuc.edu/(Gh)/ home.rxml is a site developed as part of the Weather World 2010 project by the Department of Atmospheric Sciences at the University of Illinois at Urbana-Champaign.
This chapter is designed to give balloon pilots a basic knowledge of weather principles, acquaint them with the weather information available for flight planning, and help them develop sound decision-making skills as they prepare for and execute a safe flight.
The Atmosphere
The atmosphere is the envelope of air that surrounds the Earth. Approximately one-half of the air, by weight, is within the lower 18,000 feet. The remainder of the air is spread over a vertical distance in excess of 1,000 miles. No definite outer atmospheric boundary exists, but the air particles become less numerous with increasing altitude until they gradually overcome Earth’s gravity and escape into space. In addition to the rotation of the air with the rotation of the Earth, another type of air movement occurs within the atmosphere. This movement of air around the surface of the Earth is called atmospheric circulation.
Composition
The atmosphere is a blanket of air composed of a mixture of gases that surrounds the Earth and reaches over 560 kilometers (km), 348 miles, from the surface. This blanket of gases provides protection from ultraviolet rays, as well as supporting human, animal, and plant life. Nitrogen accounts for 78 percent of the gases comprising the atmosphere, while oxygen makes up 21 percent. [Figure 4-1] Argon, carbon dioxide, and traces of other gases make up the remaining 1 percent. Within this envelope of gases, there are several recognizable layers of the atmosphere as defined by altitude.

Figure 4-1. Composition of the atmosphere.
The first layer, known as the troposphere, extends from sea level up to 20,000 feet (8 km) over the northern and southern poles and up to 48,000 feet (14.5 km) over the equatorial regions. The vast majority of weather, clouds, storms, and temperature variances occur within this first layer of the atmosphere.
At the top of the troposphere is a boundary known as the tropopause, which traps moisture and the associated weather in the troposphere. The altitude of the tropopause varies with latitude and with the season of the year which causes it to take on an elliptical shape, as opposed to round. Location of the tropopause is important because it is commonly associated with the location of the jet stream and possible clear air turbulence.
The Standard Atmosphere
To provide a common reference when discussing weather, the International Standard Atmosphere (ISA) has been established. To arrive at the standard atmosphere, conditions throughout the atmosphere with respect to latitudes, seasons, and altitudes were averaged. The standard reference point is 59 °F or 15 °C, and 29.92 inches of mercury (“Hg) or 1013.2 millibars (mb). Pressure does not decrease linearly with altitude, but for the first 10,000 feet, 1 “Hg for each 1,000 feet approximates the rate of pressure change. There is also a standard temperature lapse rate of 3.5 °F or 2 °C per 1,000 feet of altitude, up to 36,000 feet.
At sea level, the atmosphere exerts pressure on the Earth at a force of 14.7 pounds per square inch (psi). This means a column of air one inch square, extending from the surface up to the upper atmospheric limit, weighs about 14.7 pounds.
A person standing at sea level also experiences the pressure of the atmosphere, but the pressure is a force of pressure over the entire surface of the skin. The actual pressure at a given place and time will differ with altitude, temperature, and density of the air. These conditions also affect balloon performance, especially with regard to useful load and burner performance.
Measurement of Atmospheric Pressure
Constant pressure charts and hurricane pressure reports are written using millibars (mb). Since weather stations are located around the globe, all local barometric pressure readings are converted to a sea level pressure to provide a standard for records and reports. To achieve this, each station converts its barometric pressure by adding approximately 1 “Hg for every 1,000 feet of elevation gain. For example, a station at 5,000 feet above sea level, with a reading of
24.92 “Hg, reports a sea level pressure reading of 29.92 “Hg. Using common sea level pressure readings helps ensure aircraft altimeters are set correctly, based on the current pressure readings. In order to compensate for pressure variations due to different station elevations, all observations are mathematically corrected to mean sea level (MSL). Altimeter settings are obtained by mathematically reducing station pressure to MSL. This enables the pilot to read MSL altitudes on the altimeter.
When charting atmospheric pressures over various areas of the Earth, the meteorologist is primarily interested in the pressure difference per unit of distance—the pressure gradient.
The MSL pressure is plotted in mb at each reporting station on a surface weather map. The isobars outline pressure areas in somewhat the same manner that contour lines outline terrain features on contour maps. Standard procedure on surface weather maps in North America is to draw isobars spaced at four mb of pressure apart, with intermediate two mb spacing when appropriate. Although the isobar patterns are never the same on any two weather maps, they do show patterns of similarity.
By tracking barometric pressure trends across a large area, weather forecasters can more accurately predict movement of pressure systems and the associated weather. For example, tracking a pattern of rising pressure at a single weather station generally indicates the approach of fair weather. Conversely, decreasing or rapidly falling pressure usually indicates approaching bad weather and possibly severe storms.
Temperature
Temperature is a measurement of the amount of heat and expresses a degree of molecular activity. Since different substances have different molecular structures, equal amounts of heat applied to equal volumes of two different substances will result in unequal heating. Every substance has its own unique specific heat. For example, a land surface becomes hotter than a water surface when equal amounts of heat are added to each. The degree of “hotness” or “coldness” of a substance is known as its temperature, and is measured with a thermometer.
The Earth’s surface is heated during the day by the sun. This incoming solar radiation is called insolation, while heat radiated from the Earth by outgoing radiation is called terrestrial radiation. The cooling that occurs at night is terrestrial radiation.
Temperature Scales
Two temperature scales are important to the balloon pilot: Fahrenheit (F) and Celsius (C). On the Fahrenheit scale, the freezing point is 32° and the boiling point is 212°, a difference of 180°. On the Celsius scale, the freezing point is 0° and the boiling point is 100°. For many years, the Celsius scale was the choice for technicians and those countries and organizations utilizing the metric system. In recent years, the United States has transitioned to almost exclusive use of the Celsius scale in weather reports, primarily because of the International Civil Aviation Organization (ICAO) convention agreements. [Figure 4-2]

Figure 4-2. Comparison of Fahrenheit and Celsius temperature scales.
A quick and easy way to convert Fahrenheit to Celsius is to subtract 30, and divide the number by two. To convert Celsius to Fahrenheit, double the number, and add 30. These formulas give a good approximation for most calculations in ballooning. Conversion charts are also available on the Internet.
Temperature Variations
The amount of solar radiation (insolation) received by any region varies with the time of day, with seasons, and with latitude. These differences in insolation create temperature variations. Temperatures also vary with differences in topographical surface and with altitude. These temperature variations create forces that drive the atmosphere in its motion. Simply stated, heat and, therefore, temperature differences cause weather.
Diurnal variation is the change in temperature from day to night brought about by the daily rotation of the Earth. The Earth receives heat during the day by insolation, but continually loses heat by terrestrial radiation. Warming and cooling depend on an imbalance of insolation and terrestrial radiation. During the day, insolation exceeds terrestrial radiation and the surface becomes warmer. At night, insolation ceases, but terrestrial radiation continues and cools the surface. Cooling continues after sunrise until insolation again exceeds terrestrial radiation. Minimum temperature usually occurs after sunrise, sometimes as much as one hour after. The continued cooling after sunrise is one reason that fog sometimes forms shortly after the sun is above the horizon.
Temperature Variations with Topography
Temperature variations are also induced by water and terrain. Water absorbs and radiates heat energy with less temperature change than does land. Large, deep water bodies tend to
minimize temperature changes, while large land masses induce major temperature changes. Wet soil, such as that found in swamps and marshes, is almost as effective as water in suppressing temperature changes. Thick vegetation tends to control temperature changes since it contains some water and also insulates against heat transfer between the ground and the atmosphere. Arid, barren surfaces generate the greatest temperature changes.
These topographical influences are both diurnal and seasonal. For example, the difference between a daily maximum and minimum may be 10° or less over water, near a shore line, or over a swamp or marsh, while a difference of 50° or more is common over rocky or sandy deserts.
Abrupt temperature differences develop along lake and ocean shores. These variations generate pressure differences and local air flows or winds, which may become a consideration in the balloon pilot’s study of the air mass.
Prevailing wind is also a factor in temperature control. In an area where prevailing winds are from large water bodies, temperature changes are rather small. Most islands enjoy fairly constant temperatures. On the other hand, temperature changes are more pronounced where prevailing wind is from dry, barren regions.
Temperature Variation with Altitude
Temperature normally decreases with increasing altitude throughout the troposphere. This decrease of temperature with altitude is defined as lapse rate. The standard lapse rate seldom exists. In fact, temperature sometimes increases with height. An increase in temperature with altitude is defined as an inversion.
An inversion often develops near the ground on clear, cool nights when wind is light. The ground radiates and cools much faster than the overlying air. Air in contact with the ground becomes cold, while the temperature a few hundred feet above changes very little. Thus, temperature increases with height. Inversions may also occur at any altitude when conditions are favorable. For example, a current of warm air aloft overrunning cold air near the surface produces an inversion aloft.
Low level inversions, which are usually of most interest to the balloon pilot, generally dissipate as the air mixes with insolation.
Heat Transfer
The heat source for this planet is the sun; energy from the sun is transferred through space and the Earth’s atmosphere to the Earth’s surface. As this energy warms the Earth’s surface and atmosphere, some of it is or becomes heat energy. Heat is transferred into the atmosphere in three ways: radiation, conduction, and convection.
Radiation
Radiation is the transfer of heat by electromagnetic waves. No medium of transfer is required between the radiator and the body being irradiated (receiving the radiation). Heat waves, a form of this electromagnetic energy, may be reflected. In meteorology, the principal reflectors are the Earth’s surface, water vapor in the air, and particulate matter in the atmosphere.
Conduction
Conduction is the transfer of heat energy from one substance to another or within a substance. As with electricity, some materials are good conductors while others are poor conductors. Poor conductors are considered to be insulators. Air is one of the poorest conductors of heat in comparison to silver, one of the best conductors. Silver will pass 20,000 times more heat than an equal mass of air across a similar temperature difference during a fixed period of time. Conduction in the atmosphere is considered to be a significant method of heat exchange only at the Earth’s surface, where the lowest few centimeters of the atmosphere are actually in contact with the ground or water.
Convection
Convection is the transfer of heat energy in a fluid. This type of heating is most commonly seen in the kitchen when a liquid boils. This type of heat transfer occurs in the atmosphere when the ground is heated by the sun. The warm ground heats the air above it by radiation and conduction, causing the warm air to rise. Meanwhile, the dense cooler air aloft moves in to take the warm ground air’s place to be heated.
Heat can be transferred by convection in either a vertical or a horizontal direction. In meteorology, “advection” is the term used for the horizontal transport of heat by wind. It is important to differentiate between the vertical and horizontal paths of convection. In the atmosphere, the amount of heat transferred horizontally over the surface of the Earth by advection is about 1,000 times greater than that transferred by convection.
The Adiabatic Process
The adiabatic process is the change of the temperature of air without transferring heat. In an adiabatic process, compression results in warming, and expansion results in cooling. The adiabatic process takes place in all upward and downward moving air. When air rises into an area of lower pressure, it expands to a larger volume. As the molecules of air expand, the temperature of the air lowers. As a result, when a parcel of air rises, pressure decreases, volume increases, and temperature decreases. When air descends, the opposite is true.
Since air is composed of a mixture of gases subject to heating when compressed and cooling when expanded, air will rise, seeking a level where the pressure of the body of air is equal to the pressure of the air that surrounds it. Whatever the cause of the lifting, the air rises, and the pressure decreases, allowing the “parcel of air” to expand. This continues until it reaches an altitude similar in pressure and density to its own. As it expands, it cools through the adiabatic process and no heat is added or withdrawn from the system in which it operates. As air rises, it is cooled because it is expanding by moving to an altitude where pressure and density is less. This is adiabatic cooling. When the process is reversed and air is forced downward, it is compressed, causing it to heat by a process called adiabatic heating.
Air Masses
An air mass is a large body of air (usually 1,700 kilometers or more across) whose physical properties (temperature and humidity) are horizontally uniform. The weather is a direct result of the continuous alternation of the influences of warm and cold air masses. Warm air masses predominate in the summer, and cold air masses predominate in the winter. However, both cold and warm air, alternately, may prevail almost anywhere in the temperature zone at any season. The basic characteristics of any air mass are temperature and humidity. These properties are relatively uniform throughout the air mass, and it is by measurement of these properties that the various types of air masses are determined.
Characteristics
Air masses acquire the characteristics of the surrounding area, or source region. The characteristics of an air mass consist of the basic properties of moisture and temperature, which include:
- Stability,
- Cloud types,
- Sky coverage,
- Visibility,
- Precipitation,
- Icing, and
- Turbulence.
The terrain surface underlying the air mass is the primary factor in determining air mass characteristics.
A source region is typically an area in which the air remains relatively stagnant for a period of days or longer. During this time of stagnation, the air mass takes on the temperature and moisture characteristics of the source region. Areas of stagnation can be found in polar regions, tropical oceans, and dry deserts. Air masses are classified by region of origination:
- Polar or tropical
- Maritime or continental
A continental polar air mass forms over a polar region and brings cool, dry air with it. Maritime tropical air masses form over warm tropical waters like the Caribbean Sea and bring warm, moist air. As the air mass moves from its source region and passes over land or water, the terrain it passes over modifies its qualities, and thus modifies the nature of the air mass.
An air mass passing over a warmer surface will be warmed from below, and convective currents form, causing the air to rise. This creates an unstable air mass with good surface visibility. Moist, unstable air causes cumulus clouds, localized showers, and turbulence to form. Conversely, an air mass passing over a colder surface does not form convective currents, but instead creates a stable air mass with poor surface visibility. The poor surface visibility is due to the fact that moisture, smoke, dust, and other particles cannot rise out of the air mass and are instead trapped near the surface. A stable air mass can produce low stratus clouds and fog.
Pressure Systems
The differences that occur with heating and cooling the atmosphere in the lower levels also cause density variations. These variations cause small horizontal pressure differences that are only about one ten-thousandth of the magnitude of the normal change of pressure with altitude, but they significantly impact atmospheric circulation and most weather phenomena. [Figure 4-3]A low or cyclone is a pressure system in which the barometric pressure decreases towards the center and the wind flow around the system is counterclockwise in the Northern Hemisphere. Unfavorable flying conditions in the form of low clouds, restricted visibility by precipitation and fog, strong and gusty winds, and turbulence are common in low pressure systems. Thermal low pressure systems caused by intense surface heating and resulting low air density over barren continental areas are relatively dry with few clouds and practically no precipitation. Thermal lows are stationary and predominate over continental areas in the summer. General airflow in a low pressure system, since the atmosphere is attempting to achieve equilibrium, is in (towards the center of the low pressure system), and up. This tendency can affect the overall dynamic of the low pressure system.

Figure 4-3. High and low pressure systems
A high is a pressure system in which the barometric pressure increases toward the center and the wind flow around the system is clockwise in the Northern Hemisphere. Flying conditions are generally more favorable in highs than in lows because of fewer clouds, light or calm winds, and less concentrated turbulent areas. But, in some situations, visibility may be reduced due to early morning fog, smog, or haze at flight levels. High pressure systems predominate over cold surfaces where the air is dense. General airflow in a high pressure system, in reverse of the low pressure dynamic, is out (away from the center of the pressure system) and down. Again, these airflow tendencies can affect the dynamic of the high pressure system, much like the low.
In the Northern Hemisphere, a general cycle of highs and lows moves through the temperate zones from west to east. The movement of the pressure systems is more rapid in the winter season when the low pressure systems are most intense and the high pressure systems extend farthest to the south. [Figure 4-4]
A trough is an elongated area of low pressure, with the lowest pressure along the trough line. The weather in a trough is commonly violent. Also, troughs can be slow moving. A ridge is an elongated area of high pressure with highest pressure along the ridge line. The weather in a ridge is generally favorable for flying.

Figure 4-4. A cross-section of the pressure systems depicted in Figure 4-3.
Fronts
Fronts are the boundaries between two air masses and are classified as to which type of air mass (cold or warm) is replacing the other. For example, a cold front demarcates the leading edge of a cold air mass displacing a warmer air mass. A warm front is the leading edge of a warmer air mass replacing a colder air mass. Fronts are also transition zones (boundaries) between air masses that have different densities. The density of air is controlled primarily by the temperature of the air. Therefore, fronts in temperate zones usually form between tropical and polar air masses, but they may also form between arctic and polar air masses. A typical surface weather map shows air mass boundary zones at ground level. Designs on the boundary lines indicate the type of front and its direction of movement. On weather maps in local weather stations, fronts may also be indicated by colored lines. A working knowledge of fronts and their accompanying weather hazards is important to pilots.
Types of Fronts
The four major frontal types are:
- Cold,
- Warm,
- Stationary, and
- Occluded.
A front type is determined from the movement of the air masses involved.
Cold Front
A cold front is the leading edge of an advancing mass of cold air. A cold front occurs when a mass of cold, dense, and stable air advances and replaces a body of warmer air. Cold fronts move more rapidly than warm fronts, generally progressing at a rate of 25 to 30 miles per hour (mph). However, extreme cold fronts have been recorded moving at speeds of up to 60 mph. A typical cold front moves in a manner opposite that of a warm front. Because it is so dense, it stays close to the ground and acts like a snowplow, sliding under the warmer air and forcing the less dense air aloft. [Figure 4-5] The rapidly ascending air causes the temperature to decrease suddenly, forcing the creation of clouds. The type of clouds that form depends on the stability of the warmer air mass. A cold front in the Northern Hemisphere is normally oriented in a northeast to southwest manner and can extend for several hundred miles, encompassing a large area of land. Prior to the passage of a typical cold front, cirriform or towering cumulus clouds are present, and cumulonimbus clouds are possible. Rain showers and haze are possible due to the rapid development of clouds. The wind from the south-southwest helps to replace the warm temperatures with the relative colder air. A high dew point and falling barometric pressure are indicative of imminent cold front passage.
As the cold front passes, towering cumulus or cumulonimbus clouds continue to dominate the sky. [Figure 4-6] Depending on the intensity of the cold front, heavy rain showers form and might be accompanied by lightning, thunder, and/or hail. More severe cold fronts can also produce tornadoes. During cold front passage, the visibility is poor, with winds variable and gusty, and the temperature and dew point drop rapidly. A quickly falling barometric pressure bottoms out during frontal passage, then begins a gradual increase. After frontal passage, the towering cumulus and cumulonimbus clouds begin to dissipate to cumulus clouds, with a corresponding decrease in the precipitation. Good visibility eventually prevails with the winds from the west-northwest. Temperatures remain cooler and the barometric pressure continues to rise.

Figure 4-5. A cold front underrunning warm, moist, stable air. Clouds are stratified and precipitation continuous. Precipitation induces stratus in the cold air.

Figure 4-6. A cold front underrunning warm, moist, unstable air. Clouds are cumuliform with possible showers or thunderstorms near the surface position of the front. Convective clouds often develop in the warm air ahead of the front. The warm, wet ground behind the front generates low-level convection and fair-weather cumulus in the cold air.
Fast-Moving Cold Front
Fast-moving cold fronts are pushed by intense pressure systems far behind the actual front. The friction between the ground and the cold front retards the movement of the front and creates a steeper frontal surface. This results in a very narrow band of weather concentrated along the leading edge of the front. [Figure 4-7] If the warm air being overtaken by the cold front is relatively stable, overcast skies and rain may occur for some distance ahead of the front. If the warm air is unstable, scattered thunderstorms and rain showers may form. A continuous line of thunderstorms, or squall line, may form along or ahead of the front. Squall lines present a serious hazard to pilots as squall type thunderstorms are intense and move quickly. Behind a fast-moving cold front, the skies usually clear rapidly and the front leaves behind gusty, turbulent winds and colder temperatures.
Warm Front
A warm front is actually the trailing edge of a retreating mass of cold air. A warm front occurs when a warm mass of air advances and replaces a body of colder air. Warm fronts move slowly, typically 10 to 25 mph. The slope of the advancing front slides over the top of the cooler air and gradually pushes it out of the area. Warm fronts contain warm air that often has very high humidity. As the warm air is lifted, the temperature drops and condensation occurs. Prior to the passage of a warm front, cirriform or stratiform clouds, along with fog, can be expected to form along the frontal boundary. [Figure 4-8] In the summer months, cumulonimbus clouds (thunderstorms) are likely to develop. Light to moderate precipitation is probable, usually in the form of rain, sleet, snow, or drizzle, punctuated by poor visibility. The wind blows from the south-southeast, and the outside temperature is cool or cold, with increasing dew point. Finally, as the warm front approaches, the barometric pressure continues to fall until the front passes completely.

Figure 4-7. A fast-moving cold front underrunning warm, moist, unstable air. Showers and thunderstorms develop along the surface position of the front.

Figure 4-8. A warm front with overrunning moist, stable air. Clouds are stratiform and widespread over the shallow front. Precipitation is continuous and induces widespread stratus in the cold air.
During the passage of a warm front, stratiform clouds are visible and drizzle may be falling. The visibility is generally poor, but improves with variable winds. The temperature rises steadily from the inflow of relatively warmer air. Usually, the dew point remains steady and the pressure levels off. After the passage of a warm front, stratocumulus clouds predominate and rain showers are possible. The visibility eventually improves, but hazy conditions may exist for a short period after passage. The wind generally blows from the south-southwest. With warming temperatures, the dew point rises and then levels off. There is generally a slight rise in barometric pressure, followed by a decrease in barometric pressure.
Stationary Front
When an air mass boundary is neither advancing nor retreating along the surface, the front is called a stationary front. Although there is no movement of the surface position of a true stationary front, an uplift of air may occur along the frontal boundary. If the uplifted air is stable and saturated, stratiform clouds may occur. Intermittent drizzle may occur, and if lifted above the freezing level, icing conditions and frozen precipitation will exist. If the uplifted air is conditionally unstable and saturation occurs, predominately cumuliform clouds will form, possibly generating thunderstorm activity.
Occluded Front
An occluded front occurs when a fast-moving cold front catches up with a slow-moving warm front. As the occluded front approaches, warm front weather prevails, but is immediately followed by cold front weather. There are two types of occluded fronts that can occur, and the temperatures of the colliding frontal systems play a large part in defining the type of front and the resulting weather. A cold front occlusion occurs when a fast-moving cold front is colder than the air ahead of the slow-moving warm front. When this occurs, the cold air replaces the cool air and forces the warm front aloft into the atmosphere. Typically, the cold front occlusion creates a mixture of weather found in both warm and cold fronts, if the air is relatively stable. A warm front occlusion occurs when the air ahead of the warm front is colder than the air of the cold front. When this is the case, the cold front rides up and over the warm front. If the air forced aloft by the warm front occlusion is unstable, the weather will be more severe than the weather found in a cold front occlusion. Embedded thunderstorms, rain, and fog are likely to occur.
Surface Fronts
The air mass boundaries indicated on a surface weather map are called surface fronts. A surface front is the position of a front at the Earth’s surface. The weather map shows only the location of fronts on the surface, but these fronts also have vertical extent. For example, the colder, heavier air mass tends to flow under the warmer air mass. The underrunning mass produces the lifting action of warm air over cold air, causing clouds and associated frontal weather.
The vertical boundary between the warm and cold air masses is a frontal surface, and slopes upward over the colder air mass. The frontal surface lifts the warmer air mass and produces frontal cloud systems. The slope of the frontal surface varies with the speed of the moving cold air mass, and the roughness of the underlying terrain. Under normal conditions, the angle of inclination (slope ratio) between the frontal surface and the Earth’s surface is greater with cold fronts than with warm fronts. The approximate height of the frontal surface over any station is determined from the analysis of upper air observations.
Frontal passage (FROPA) affects ballooning activities because it can generate precipitation, wind shifts, significant changes in temperature, and many other conditions hazardous to ballooning. Balloon pilots usually do not fly in the face of an approaching front; in fact, many have a rule that they do not fly within 18 to 24 hours prior to frontal passage, particularly if the approaching front has any significant strength associated with it. The FSS often can advise of the time a cold front will pass a given reporting station, which assists in flight planning.
Winds and Currents
Pressure and temperature changes produce two kinds of motion in the atmosphere—vertical movement of ascending and descending currents, and horizontal movement in the form of wind. Both types of motion in the atmosphere are important as they affect the takeoff, landing, and inflight operations. More important, however, is that these motions in the atmosphere, otherwise called atmospheric circulation, cause weather changes.
Understanding wind and current circulation patterns is important for a balloon pilot because balloons are maneuvered solely through interaction with the different layers of wind and current. By using knowledge of the Coriolis force, pressure gradient force, and surface friction, it is possible to predict with a high degree of accuracy the potential track over the countryside and land at a predetermined point. This skill is the mark of a competent, safety conscious balloon pilot.
Atmospheric Circulation
Three forces cause the wind to move as it does: the Coriolis force, the pressure gradient force, and surface friction. All three forces work together at the same time.
As defined earlier, atmospheric circulation is the movement of air around the surface of the Earth caused by the uneven heating of the Earth’s surface that upsets the equilibrium of the atmosphere, creates changes in air movement, and affects atmospheric pressure. Because the Earth has a curved surface that rotates on a tilted axis while orbiting the sun, the equatorial regions of the Earth receive a greater amount of heat from the sun than the polar regions. The amount of sun heating the Earth depends upon the time of day, time of year, and the latitude of the specific region. All of these factors affect the length of time and the angle at which sunlight strikes the surface.
In general atmospheric circulation theory, areas of low pressure exist over the equatorial regions, and areas of high pressure exist over the polar regions due to a difference in temperature. Solar heating causes air to become less dense and rise in equatorial areas. The resulting low pressure allows the high pressure air at the poles to flow along the planet’s surface toward the equator. As the warm air flows toward the poles, it cools, becoming more dense, and sinks back toward the surface. [Figure 4-9] This pattern of air circulation is correct in theory, but the circulation of air is modified by other forces.

Figure 4-9. General circulation theory.
The speed of the Earth’s rotation causes the general flow to break up into three distinct cells in each hemisphere. [Figure 4-10] In the Northern Hemisphere, the warm air at the equator rises upward from the surface, travels northward, and is deflected eastward by the rotation of the Earth. By the time it has traveled one-third of the distance from the equator to the North Pole, it is no longer moving northward, but eastward. This air cools and sinks in a belt-like area at about 30° latitude, creating an area of high pressure as it sinks toward the surface. Then, it flows southward along the surface back toward the equator. Coriolis force bends the flow to the right, thus creating the northeasterly trade winds that prevail from 30° latitude to the equator. Similar forces create circulation cells that encircle the Earth between

Figure 4-10. Three cell circulation pattern caused by the rotation of the Earth.
30° and 60° latitude, and between 60° and the poles. This circulation pattern results in the prevailing westerly winds in the conterminous United States.
Circulation patterns are further complicated by seasonal changes, differences between the surfaces of continents and oceans, and other factors such as frictional forces caused by the topography of the Earth’s surface which modify the movement of the air in the atmosphere. For example, within 2,000 feet of the ground, the friction between the surface and the atmosphere slows the moving air. The wind is diverted from its path because the frictional force reduces the Coriolis force. Thus, the wind direction at the surface varies somewhat from the wind direction just a few thousand feet above the Earth.
Coriolis Force
The Coriolis force is not perceptible to humans as they walk around because humans move slowly and travel relatively short distances compared to the size and rotation rate of the Earth. However, the Coriolis force significantly affects bodies that move over great distances, such as an air mass or body of water.
The Coriolis force deflects air to the right in the Northern Hemisphere, causing it to follow a curved path instead of a straight line. The amount of deflection differs depending on the latitude. It is greatest at the poles, and diminishes to zero at the equator. The magnitude of Coriolis force also differs with the speed of the moving body—the faster the speed, the greater the deviation. In the Northern Hemisphere, the rotation of the Earth deflects moving air to the right and changes the general circulation pattern of the air.
Pertinent facts about the Coriolis force:
- The Coriolis force deflection is perpendicular to the flow of air.
- The Coriolis force will deflect air to the right in the Northern Hemisphere, and to the left in the Southern Hemisphere.
- The Coriolis force is strongest at the Poles and decreases to zero at the Equator.
- The Coriolis force is zero with calm winds and increases in magnitude as wind speed increases.
- Coriolis force, in combination with other forces involved, will determine the different circulation patterns over the Earth.
Pressure Gradient
Pressure gradient is the difference in pressure between high and low pressure areas. It is the rate of change in pressure in a direction perpendicular, or across the isobars. Wind speed is directly proportional to the pressure gradient. This means the strongest winds are in the areas where the pressure gradient is the greatest. Since pressure applied to a fluid is exerted equally in all directions throughout the fluid, a pressure gradient exists in the horizontal (along the surface), as well as in the vertical (with altitude) plane in the atmosphere. [Figure 4-11]
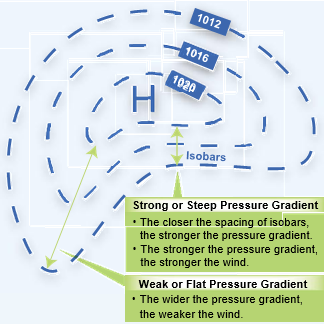
Figure 4-11. Principles of pressure gradients.
The horizontal pressure gradient is steep or strong when the isobars determining the pressure gradient are close together. It is flat or weak when the isobars are far apart. If isobars are considered as depicting atmospheric topography, a high pressure system represents a hill of air, and a low pressure system represents a valley of air. The vertical pressure gradient always indicates a decrease in pressure with altitude, but the rate of pressure decrease (gradient) varies directly with changes in air density with altitude. The vertical cross section through a high and a low depicts the surface pressure gradient.

Figure 4-12. Examples of variations of wind direction with height.
The pressure gradient force is a force that tries to equalize pressure differences. This is the force that causes high pressure to push air toward low pressure. Thus, air would flow from high to low pressure if the pressure gradient force was the only force acting on it.
Surface Friction
Friction is the third component that determines the flow of wind. Because the surface of the Earth is rough, it not only slows the wind down, it also causes the diverging winds from highs and converging winds near lows. Since the Coriolis force varies with the speed of the wind, a reduction in the wind speed by friction means a reduction of the Coriolis force. This results in a momentary disruption of the balance. When the new balance (including friction) is reached, the air flows at an angle across the isobars from high pressure to low pressure. This angle varies from 10° over the ocean to more than 45° over rugged terrain. Frictional effects on the air are greatest near the ground, but the effects are also carried aloft by turbulence. Surface friction is effective in slowing the wind up to an average altitude of 2,000 feet above the ground. Above this level, the effect of friction decreases rapidly and may be considered negligible. Air above 2,000 feet above the ground normally flows parallel to the isobars. [Figures 4-12 and 4-13]
Wind Patterns
Since air always seeks out lower pressure, it flows from areas of high pressure into those of low pressure. In the Northern Hemisphere, this flow of air from areas of high to low pressure is deflected to the right and produces a clockwise circulation around an area of high pressure known as anti- cyclonic circulation. The opposite is true of low pressure

Figure 4-13. Gradient winds.
areas; the air flows toward a low and is deflected to create a counter-clockwise or cyclonic circulation.
High pressure systems are generally areas of dry, stable, descending air. Good weather is typically associated with high pressure systems for this reason. Conversely, air flows into a low pressure area to replace rising air. This air tends to be unstable, and usually brings increasing cloudiness and precipitation. Thus, bad weather is commonly associated with areas of low pressure.
Convective Currents
Convection currents refer to the upward moving portion of a convection circulation, such as a thermal or the updraft in cumulus clouds. The uneven heating of the air, due to different surfaces radiating heat in varying amounts, create small areas of local circulation. For example, plowed ground, rocks, sand, and barren land give off a large amount of heat, while water, trees, and other areas of vegetation tend to absorb and retain heat. Convective currents cause the bumpy, turbulent air sometimes experienced when flying at lower altitudes during warmer weather. On a low altitude flight over varying surfaces, updrafts are likely to occur over pavement or barren places, and downdrafts often occur over water or expansive areas of vegetation like a group of trees. Typically, these turbulent conditions can be avoided by flying at higher altitudes.
Convective currents are particularly noticeable in areas with a land mass directly adjacent to a large body of water, such as an ocean, large lake, or other appreciable area of water. During the day, land heats faster than water, so the air over the land becomes warmer and less dense. It rises and is replaced by cooler, denser air flowing in from over the water. This causes an onshore wind, called a sea breeze. Conversely, at night land cools faster than water, as does the corresponding air. In this case, the warmer air over the water rises and is replaced by the cooler, denser air from the land, creating an offshore wind called a land breeze. This reverses the local wind circulation pattern. Convective currents can occur anywhere there is an uneven heating of the Earth’s surface. [Figure 4-14]
Convection currents close to the ground can affect a pilot’s ability to control the balloon. On final approach, for example, the rising air from terrain devoid of vegetation sometimes produces a ballooning effect that can cause a pilot to overshoot the intended landing spot. On the other hand, an approach over a large body of water or an area of thick vegetation tends to create a sinking effect that can cause an unwary pilot to land short of the intended landing spot. This could prove particularly hazardous to a balloon landing in a small, confined area, as the “undershoot” of the approach could potentially put the balloon into the trees or power lines.
The Jet Stream
The jet stream refers to relatively strong winds concentrated in a narrow stream in the atmosphere. These winds are normally horizontal, high altitude winds. The position and orientation of jet streams vary from day to day. General weather patterns (hot/cold, wet/dry) are related closely to the position, strength, and orientation of the jet stream (or jet streams). A jet stream at low levels is known as a low level jet stream. Since it is of interest primarily to high level flight, further discussion is not necessary.

Figure 4-14. Land-sea breezes
Local and Small-Scale Winds
Gradient Winds
Pressure gradients initiate the movement of air and as soon as the air acquires velocity, the Coriolis force deflects it to the right in the Northern Hemisphere. As the speed of the air along the isobars increases, the Coriolis force becomes equal and opposite to the pressure gradient force. After a period of time, the air moves directly parallel to the curved isobars if there is no frictional drag with the surface. The air no longer moves toward lower pressure because the pressure gradient force is completely neutralized by the Coriolis force and the centrifugal force.
Orographic Winds
The term “orographic” has multiple meanings, when placed in the context of weather phenomena. In a general sense, according to the American Meteorological Society, wind flows that are caused, affected, or influenced by mountains may be said to be orographic winds flows. The term has come to mean any winds that are affected by terrain, not just mountains; this definition is probably the most frequently used, when discussing balloon flight.
As a specific term, “orographic lifting” is defined as an ascending air flow caused by mountains. The mechanisms that produce the orographic lifting fall into two broad categories:
- The upward deflection of horizontal large-scale air flow by the terrain acting as an obstacle or barrier, or
- The daytime heating of mountain surfaces to produce an anabatic flow (see below) along the slopes and updrafts in the vicinity of mountain peaks.
This definition, while strictly referring only to lifting by mountains, is sometimes extended to include the effects of hills or long sloping terrain. When sufficient moisture is present in the rising air, Orographic fog or clouds may form.
Anabatic Winds
Anabatic winds are those that blow up a steep slope or mountain side. It is sometimes referred to as an upslope flow. These winds typically occur during the daytime in calm, sunny weather. A hill or mountaintop may be warmed by the sun, which in turn heats the air just above it. As that air rises through convection, it creates a low pressure region, into which the air at the bottom of the slope flows, and causes winds.
Katabatic Winds
Katabatic winds are the reverse of anabatic winds; that is, they flow down slope, and most frequently at night. They are created by the effect of the air near the ground losing heat thru radiational cooling at a faster rate than air at a similar altitude over the surrounding land mass.
Clouds
Clouds are weather signposts in the sky. They provide the balloon pilot with visible evidence of the atmospheric motion, water content, and degree of stability. In this sense, clouds are of significant importance to the aeronaut. However, when they become too numerous or widespread, form at low levels, or show extensive vertical development, they present weather hazards to ballooning.
Clouds are visible condensed moisture, consisting of droplets of water or crystals of ice. They are supported and transported by air movements as slow as one-tenth of a mile per hour. Cloud formation is the direct result of saturation producing processes which take place in the atmosphere. A pilot should be able to identify cloud formations that are associated with weather hazards. Knowledge of cloud types will also assist the pilot in interpreting weather conditions from weather reports and existing weather.
Cloud Formation
Clouds are often indicative of future weather. For clouds to form, there must be adequate water vapor and condensation nuclei (miniscule particles of matter like dust, salt, and smoke), as well as a method by which the air can be cooled. When the air cools and reaches its saturation point, the invisible water vapor changes into a visible state. Through the processes of sublimation and condensation, moisture condenses or sublimates onto condensation nuclei. The nuclei are important because they provide a means for the moisture to change from one state to another.
Cloud type is determined by its height, shape, and behavior. They are classified according to the height of their bases as low, middle, or high clouds, as well as clouds with vertical development. The International Cloud Classification is designed to provide a uniform cloud classification system. [Figure 4-15] Within this system, cloud types are usually divided into four major groups and further classified in terms of their forms and appearance.

Figure 4-15. Cloud classification per international agreement.
The four major groups are:
- Low clouds,
- Middle clouds,
- High clouds, and
- Clouds with vertical development.
Cloud classification can be further broken down into specific cloud types according to the outward appearance and cloud composition. Knowing these terms can help identify visible clouds. The following is a list of cloud classifications:
- Cumulus—heaped or piled clouds
- Stratus—formed in layers
- Cirrus—ringlets, fibrous clouds, also high-level clouds above 20,000 feet
- Castellanus—common base with separate vertical development, castle-like
- Lenticularus—lens shaped, formed over mountains in strong winds
- Nimbus—rain-bearing clouds
- Fracto—ragged or broken
- Alto—meaning high, also middle-level clouds existing at 5,000 to 20,000 feet

Figure 4-16. Stratus clouds.

Figure 4-17. Stratocumulus clouds.
Low clouds are those that form near the Earth’s surface. The low cloud group consists of stratus and stratocumulus clouds. [Figures 4-16 and 4-17] Clouds in this family create low ceilings, hamper visibility, and can change rapidly. Because of this, they influence flight planning and can make visual flight rules (VFR) flight impossible. The bases of these clouds can start near the surface, with the top extending to 6,500 feet or more above the terrain. Low clouds are of great importance to the balloon pilot, as they can create low ceilings and poor visibility. The heights of the cloud bases may change rapidly. If low clouds form below 50 feet, they are classified as fog, and may completely blanket landmarks and landing fields.
Middle clouds form around 6,500 feet above ground level (AGL) and extend up to 20,000 feet AGL. They are composed of water, ice crystals, and supercooled water droplets. The middle cloud group consists of altocumulus [Figure 4-18], altostratus, and nimbostratus [Figure 4-19] clouds. Altocumulus clouds, which usually form when altostratus clouds are breaking apart, also may contain light turbulence and icing. Altostratus clouds can produce turbulence and may contain moderate icing. The altocumulus has many variations in appearance and formation, whereas the altostratus varies mostly in thickness, from very thin to several thousand feet. Bases of the middle clouds start as low as 6,500 feet and tops can range as high as 20,000 feet above the terrain. These clouds may be composed of ice crystals or water droplets (which may be supercooled). Altocumulus rarely produces precipitation, but altostratus usually indicates the proximity of unfavorable flying weather and precipitation.
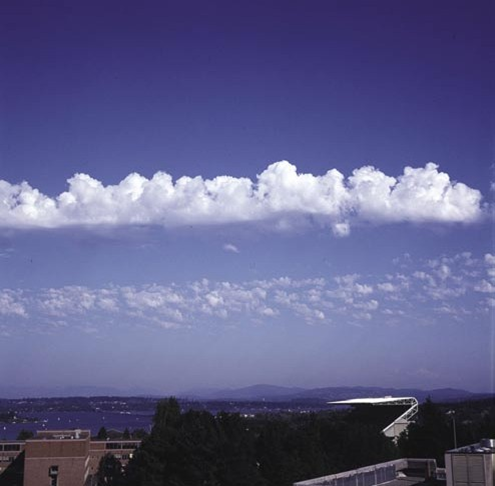
Figure 4-18. Altocumulus clouds.
High clouds form above 20,000 feet AGL and usually form only in stable air. The high cloud group consists of cirrus, cirrocumulus, and cirrostratus clouds. The mean base level of these three cloud types starts at 18,000 feet or higher above terrain. Cirrus clouds [Figure 4-20] may give indications of approaching weather changes. Cirriform clouds are composed of ice crystals, are generally thin, and the outline of the sun or moon may sometimes be seen through them, producing a halo or corona effect. High clouds are generally of no interest to the balloon pilot, other than they may indicate future conditions.
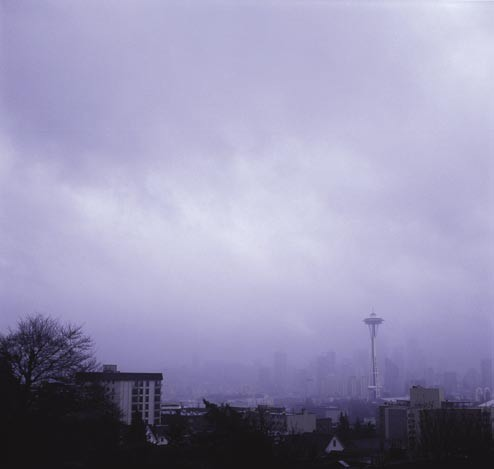
Figure 4-19. Nimbostratus clouds.
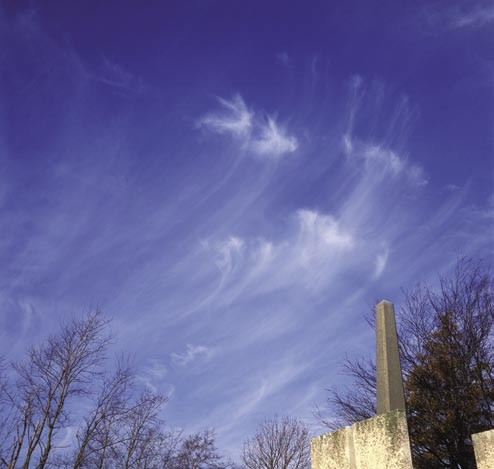
Figure 4-20. Cirrus clouds.
Clouds with extensive vertical development are cumulus clouds that build vertically into towering cumulus or cumulonimbus clouds, often developing into thunderstorms. The bases of these clouds form in the low to middle cloud region, but can extend into high altitude cloud levels. Towering cumulus clouds indicate areas of instability in the atmosphere, and the air around and inside them is turbulent. These clouds generally have their bases below 6,500 feet above the terrain and tops sometimes extend above 60,000 feet. Clouds with extensive vertical development are caused by lifting action, such as convective currents, orographic lift, or frontal lift.
Scattered cumulus or isolated cumulonimbus clouds seldom present a flight problem, since these clouds can usually be circumnavigated without difficulty. However, these clouds may rapidly develop in groups or lines of cumulonimbus. They may also become embedded and hidden in stratiform clouds, resulting in hazardous flight conditions.
Within the high, middle, and low cloud groups are two main subdivisions. These are:
- Clouds formed when localized vertical currents carry moist air upward to the condensation level. These vertical development clouds are characterized by their lumpy or billowy appearance, and are designated cumuliform type clouds, meaning “accumulation” or “heap.” Turbulent flying conditions usually exist in, below, around, and above cumuliform clouds.
- Clouds formed when complete layers of air are cooled until condensation takes place. These clouds are stratiform type clouds, meaning “layered out,” since they lie mostly in horizontal layers or sheets. Flight in stratiform cloud conditions is usually smooth.
In addition to the two main subdivisions discussed above, is the word nimbus, meaning “rain cloud.” These clouds normally produce heavy precipitation, either liquid or solid. For example, a stratiform cloud producing precipitation is referred to as nimbostratus, and a heavy, swelling cumulus cloud that has grown into a thunderstorm is referred to as cumulonimbus.
Cumulonimbus clouds contain large amounts of moisture and unstable air, and usually produce hazardous weather phenomena such as lightning, hail, tornadoes, gusty winds, and wind shear. These extensive vertical clouds can be obscured by other cloud formations and are not always visible from the ground or while in flight. When this happens, these clouds are said to be embedded, hence the term, embedded thunderstorms.
To pilots, the cumulonimbus cloud is perhaps the most dangerous cloud type. It appears individually or in groups and is known as either an air mass or orographic thunderstorm. Heating of the air near the Earth’s surface creates an air mass thunderstorm; the upslope motion of air in the mountainous regions causes orographic thunderstorms. Cumulonimbus clouds that form in a continuous line are nonfrontal bands of thunderstorms or squall lines.
Knowledge of principal cloud types and the factors that affect them helps the pilot visualize expected weather conditions, and to recognize potential weather hazards.
Ceilings and Visibilities
Ceilings and visibilities have an important role in the classification of sky conditions, and are critical for the definition of flight restrictions. It is necessary to define these terms to make those distinctions clear for the balloon pilot.
Ceiling
For aviation purposes, a ceiling is the lowest layer of clouds reported as being broken or overcast, or the vertical visibility into an obscuration like fog or haze.
Observations are made using the concept of the “celestial dome,” the hemisphere of sky which can be seen from a specific point on the ground. Cloud coverage is reported as the total cloud cover at and below a specific layer, and is reported in one-eighth increments (octals). A ceiling is reported as broken when five-eighths to seven-eighths of the sky is covered with clouds. Overcast means the entire sky is covered with clouds.
Current ceiling information is reported by the aviation routine weather report (METAR) and automated weather stations of various types. Ceilings are reported in height AGL.
Visibility
Closely related to cloud cover and reported ceilings is visibility information. Visibility refers to the greatest horizontal distance at which prominent objects can be viewed with the naked eye. Visibilities reported in standard weather reports are horizontal surface visibilities and are generally considered linear. Predominant visibility is the greatest horizontal distance over which objects can be seen and identified over at least half of the horizon. In the United States, prevailing visibilities are reported in statute miles and portions thereof.
Since prevailing visibility is used for reporting purposes, three miles visibility does not mean that a pilot must have one and one half miles visibility in front of and behind the balloon, but that the predominant visibility in most quadrants must be three miles.
Current visibility is reported in METAR and other aviation weather reports, as well as automated weather stations. Visibility information is available during a preflight weather briefing.
Temperature/Dew Point Relationship
The relationship between dew point and temperature defines the concept of relative humidity. The dew point, given in degrees, is the temperature at which the air can hold no more moisture. When the temperature of the air is reduced to the dew point, the air is completely saturated and moisture begins to condense out of the air in the form of fog, dew, frost, clouds, rain, hail, or snow.
As moist, unstable air rises, clouds often form at the altitude where temperature and dew point reach the same value. When lifted, unsaturated air cools at a rate of 5.4 °F per 1,000 feet and the dew point temperature decreases at a rate of 1 °F per 1,000 feet. This results in a convergence of temperature and dew point at a rate of 4.4 °F. A pilot can determine the height of the cloud base by applying the convergence rate to the reported temperature and dew point in the following manner:
Temperature (T) = 85 °F Dew point (DP) = 71 °F
Convergence Rate (CR) = 4.4°
T – DP = Temperature Dew Point Spread (TDS) TDS ÷ CR = X
X x 1,000 feet = height of cloud base AGL
Example:
85 °F – 71 °F = 14 °F
14 °F ÷ 4.4 °F = 3.18
3.18 x 1,000 = 3,180 feet AGL
The height of the cloud base is 3,180 feet AGL.
Explanation:
With an outside air temperature (OAT) of 85 °F at the surface, and dew point at the surface of 71 °F, the spread is 14 °F. Divide the temperature dew point spread by the convergence rate of 4.4 °F, and multiply by 1,000 to determine the approximate height of the cloud base.
This relationship is useful in determining the height of the overlying cloud base when completing preflight preparations.
Fog
Fog is a cloud that begins within 50 feet of the surface. It typically occurs when the temperature of air near the ground is cooled to the air’s dew point. At this point, water vapor in the air condenses and becomes visible in the form of fog. Fog is classified according to the manner in which it forms and is dependent upon the current temperature and the amount of water vapor in the air.
Fog is composed of minute droplets of water or ice crystals suspended in the atmosphere with no visible downward motion. It is one of the most common and persistent weather hazards encountered by balloonists. Similar to stratus clouds, the base of fog is at the Earth’s surface while the base of a cloud is at least 50 feet above the surface. Fog may be distinguished from haze by its dampness and gray color. It is hazardous during takeoffs and landings, as well as the inflight process, because it restricts surface visibility. Knowledge of fog formation and dissipation processes, as well as types of fog help the balloon pilot plan a flight more accurately.
Fog Formation
Since neither condensation nor sublimation occurs unless the relative humidity is near 100 percent, a high relative humidity is of prime importance in the formation of fog. The natural conditions which bring about a high relative humidity (saturation) are also fog-producing processes, such as the evaporation of additional moisture into the air or cooling of the air to its dew point temperature. A high relative humidity can be estimated, from hourly sequence reports, by determining the spread (difference in degrees) between the temperature and dew point. Fog rarely occurs when the spread is more than 2.2 °C. It is most frequent when the spread is less than 1.1 °C.
A light wind is generally favorable for fog formation. It causes a gentle mixing action, which spreads surface cooling through a deeper layer of air and increases the thickness of the fog.
Although most regions of the Earth have sufficient condensation nuclei to permit fog formation, the amount of smoke particles and sulphur compounds in the vicinity of industrial areas is pronounced. In these regions, persistent fog may occur with above average temperature-dew point spreads.
Fog tends to dissipate when the relative humidity decreases. During this decrease, the water droplets evaporate or ice crystals undergo sublimation, and the moisture is no longer visible. Either strong winds or heating processes may cause the decrease in relative humidity.
Some Fog Types and Characteristics
Radiation Fog
Radiation fog forms after the Earth has radiated back to the atmosphere the heat gained during daylight hours. By early morning, the temperature at the surface may drop more than 11 °C. Since the dew point temperature (moisture content) of the air normally changes only a few degrees during the night, the temperature-dew point spread will decrease as the air is cooled by contact with the cold surface. If the radiational cooling is sufficient, and other conditions are favorable, radiation fog will form. Radiation fog is most likely when the:
- Wind is light (less than 7 knots).
- Sky is clear (maximum radiational cooling).
- Moisture content is high (narrow temperature-dew point spread).
Advection Fog
The movement of warm moist air over a colder surface creates advection fog which is common along coastal regions where the temperature of the land surface and the water surface contrasts. The southeastern area of the United States provides ideal conditions for advection fog formation during the winter months. If air flows (advection) from the Gulf of Mexico or the Atlantic Ocean over the colder continent, this warm air is cooled by contact with the cold ground. If the temperature of the air is lowered to the dew point temperature, fog will form. Advection fog, forming under these conditions, may extend over larger areas of the nation east of the Rockies. It may persist throughout the day or night until replaced by a drier air mass.
If advection fog forms over water, it is often referred to as sea fog. Cold ocean currents, such as those off the coast of California, may cool and saturate moist air coming from the warmer areas of the open sea. Sea fog is often dense offshore, as well as onshore.
As advection fog moves inland during the winter, the colder land surface often causes sufficient contact cooling to keep the air saturated. The fog may then persist during the day or with a wind speed of 10 to 15 knots.
Valley Fog
During the evening hours, cold dense air will drain from areas of higher elevation into low areas of valleys. As the cool air accumulates in the valleys, the air temperature may decrease to the dew point temperature, causing a dense formation of valley fog. While higher elevations may often remain clear throughout the night, the ceiling and visibility become restricted in the valley.
Evaporation Fog
Fog formed by the addition of moisture to the air is called evaporation fog. The major types of evaporation fog are frontal fog and steam fog.
Frontal fog is normally associated with slow-moving winter frontal systems. Frontal fog forms when liquid precipitation, falling from the maritime tropical air above the frontal surface, evaporates in the polar air below the frontal surface. Evaporation from the falling drops may add sufficient water vapor to the cold air to raise the dew point temperature to the temperature of the air. The cold air will then be saturated, and frontal fog will form. Frontal fog is common with active warm fronts during all seasons. It occurs ahead of the surface front in an area approximately 100 miles wide. It is, therefore, frequently mixed with intermittent rain or drizzle. When fog forms ahead of the warm front, it is called prefrontal fog. A similar fog formation may occur in the polar air along a stationary front. Occasionally, a slow-moving winter cold front with light wind may generate fog. This fog forms in the polar air behind the surface front and is known as postfrontal fog.
Steam fog forms when cold stable air flows over a nonfrozen water surface that is several degrees warmer than the air. The intense evaporation of moisture into the cold air saturates the air and produces fog. Conditions favorable for steam fog are common over lakes and rivers in the fall and over the ocean in the winter when an offshore wind is blowing.
Atmospheric Stability and Instability
A stable atmosphere resists upward or downward movement, and small vertical disturbances dampen out and disappear. An unstable atmosphere allows an upward or downward disturbance to grow into a vertical or convective current allowing small vertical air movements to become larger, resulting in turbulent airflow and convective activity. Instability can lead to significant turbulence, extensive vertical clouds, and severe weather.
Rising air expands and cools due to the decrease in air pressure as altitude increases. The opposite is true of descending air; as atmospheric pressure increases, the temperature of descending air increases as it is compressed. This adiabatic process (heating or cooling) takes place in all upward and downward moving air.
When air rises into an area of lower pressure, it expands to a larger volume. As the molecules of air expand, the temperature of the air lowers. As a result, when a parcel of air rises, pressure decreases, volume increases, and temperature decreases. When air descends, the opposite is true.
Since water vapor is lighter than air, moisture decreases air density, causing it to rise. Conversely, as moisture decreases, air becomes denser and tends to sink. Since moist air cools at a slower rate, it is generally less stable than dry air since the moist air must rise higher before its temperature cools to that of the surrounding air. The dry adiabatic lapse rate (unsaturated air) is 3 °C (5.4 °F) per 1,000 feet. The moist adiabatic lapse rate varies from 1.1 °C to 2.8 °C (2 °F to 5 °F) per 1,000 feet. The combination of moisture and temperature determine the stability of the air and the resulting weather. Cool, dry air is very stable and resists vertical movement, which leads to good and generally clear weather. The greatest instability occurs when the air is moist and warm, as it is in the tropical regions in the summer. Typically, thunderstorms appear on a daily basis in these regions due to the instability of the surrounding air.
The normal flow of air tends to be horizontal. If this flow is disturbed, a stable atmosphere will resist any upward or downward displacement. It will tend to return quickly to normal horizontal flow. An unstable atmosphere, on the other hand, will allow these upward and downward disturbances to grow, resulting in rough (turbulent) air. An example is the towering thunderstorm which grows as a result of large and intensive vertical movement or air. It climaxes in lightning, thunder, and heavy precipitation, sometimes including hail.
Atmospheric resistance to vertical motion, called stability, depends upon the vertical distribution of the air’s weight at a particular time. The weight varies with air temperature and moisture content. In comparing two parcels of air, warmer air is lighter than colder air, and moist air is lighter than dry air. If air is relatively warmer or moister that its surroundings, it is forced to rise and would be unstable. If the air is colder or dryer than its surroundings, it will sink until it reaches its equilibrium, and would be stable. The atmosphere can be at equilibrium only when light air is above heavier air.
Temperature has a significant effect on the stability or instability of the air mass. Air heated near the Earth’s surface on a hot summer day will rise. The speed and vertical extent of its travel depends on the temperature distribution of the atmosphere. Vertical air currents, resulting from the rise of air, can vary from the severe downdraft and compensating downdraft associated with thunderstorms to the closely spaced upward and downward bumps that are felt on warm days when flying at low levels. Since the temperature of air is an indication of its density, a comparison of temperatures from one level to another can approximate the degree of the atmosphere’s stability, or how much it will tend to resist vertical motion.
Types of Stability
The five types of atmospheric stability are:
- Absolute stability
- Absolute instability
- Conditional instability
- Neutral stability
- Convective stability
Absolute stability occurs when the actual lapse rate in a layer of air is less than the moist adiabatic lapse rate; that air is absolutely stable regardless of the amount of moisture it contains. A parcel of absolutely stable air which is lifted becomes cooler than the surrounding air and sinks back to its original position as soon as the lifting force is removed.
Similarly, if forced to descend, it becomes warmer than the surrounding air; like a cork in water, it rises to its original position upon removal of the outside force.
Absolute instability exists when the actual lapse rate in a layer of air is greater than the dry adiabatic lapse rate; that air is absolutely unstable regardless of the amount of moisture it contains. A parcel of air lifted even slightly will immediately be warmer than its surroundings, and, as with a hot air balloon, will be forced to rise.
Conditional instability exists when the temperature lapse rate of the air involved lies between the moist and dry adiabatic rates of cooling. Before the displaced air actually becomes unstable, it must be lifted to a point where it is warmer than the surrounding air. When this point has been reached, the relatively warmer air continues to rise freely until, at some higher altitude, its temperature has cooled to the temperature of the surrounding air. In the instability process, numerous variables tend to modify the air. One of the most important of these variables is the process called entrainment. In this process, air adjacent to the cumulus or mature thunderstorm is drawn into the cloud primarily by strong updrafts within the cloud. The entrained air modifies the temperature of the air within the cloud as the two become mixed.
Neutrally stable air is air with the same temperature, and there is no parcel to rise or descend. For example, the surface area in contact with that air is of the same temperature.
The term convective instability refers to a condition in which the air becomes unstable after lifting. From a physical standpoint, it closely resembles a conditionally unstable air mass, but has the mechanical lifting of thermal activity impacting on the overall characteristics of the air.
Effects of Stable and Unstable Air
The degree of stability of the atmosphere helps to determine the type of clouds formed, if any. For example, if very stable air is forced to ascend a mountain slope, clouds will be layer-like with little vertical development and little or no turbulence. Unstable air, if forced to ascend the slope, would cause considerable vertical development and turbulence in the cumulus-type clouds.
If air is subsiding (sinking), the heat of compression frequently causes an inversion of temperature which increases the stability of the subsiding air. When this occurs, as in winter high pressure systems, a surface inversion formed by radiational cooling is sometimes already present. The subsidence-produced inversion, in this case, will intensify the surface inversion, placing a strong “lid” above smoke and haze. Poor visibility in the lower levels of the atmosphere results, especially near industrial areas. Such conditions frequently persist for days, notably in the Great Basin region of the western United States.
Weather Hazards
Turbulence
Turbulence is the irregular motion of the atmosphere as indicated by gusts and lulls in the wind. Since turbulence is associated with many different weather situations, knowledge of its causes and its behavior will help a balloon pilot avoid or minimize its effects.
Turbulence can be divided into four categories according to the specific causes:
- Thermal—caused by localized convective currents due to surface heating or unstable lapse rates and cold air moving over warmer ground or water
- Mechanical—resulting from wind flowing over irregular terrain or obstructions
- Frontal—resulting from the local lifting of warm air by cold air masses, or the abrupt wind shift (shear) associated with most cold fronts
- Wind shear—marked gradient in wind speed and/or direction due to general vibrations in the temperature and pressure fields aloft
Two or more of the above causative factors often work together. In addition, turbulence is produced by manmade phenomena.
Thermal
A thermal is simply the updraft in a small-scale convective current. Convective currents (vertical or horizontal air movements) develop in air, which is heated by contact with a warm surface. This heating from below occurs when either cold air is advected (moved horizontally) over a warmer surface or the ground is strongly heated by solar radiation.
The strength of convective currents depends in part on the extent to which the Earth’s surface has been heated, which depends upon the nature of the surface. Barren surfaces, such as sandy or rocky wasteland and plowed fields, are heated more rapidly than surfaces covered in vegetation. Thus, barren surfaces generally cause stronger convection currents. In comparison, water surfaces are heated more slowly.
When air is very dry, convective currents may be present although convective-type clouds (cumulus) are absent. The general upper limits of the convective currents are often marked by the tops of cumulus clouds, which form in them when the air is moist, or by haze lines. However, turbulence may extend beyond this boundary. Varying types of surfaces, and the resultant thermal conditions, can affect a balloon to a considerable extent.
The balloon pilot caught in a thermal will recognize the condition by an increase in altitude without application of heat from the balloon’s heater. This ascent can be rapid and may exceed the maximum rate of climb limitations in the balloon’s flight manual. Since the air mass is also rising with the balloon, there is no significant pressure against the top of the balloon. Thus, the top cap will not be pushed open (commonly referred to as “floating the top”).
Depending on their size, some thermals may have a rotative motion similar to a small low pressure system. This motion draws the balloon in and forces it to fly in an uncontrolled circle. For balloons caught in a thermal, remember the adage “altitude is your friend.” First, the pilot should insure there is sufficient altitude to clear potential obstacles. Second, maintain the temperature in the balloon appropriate for level flight. Many pilots attempt to descend immediately, but this may put the balloon, as well as the passengers, at risk of an uncontrolled descent with possible injury. Most thermals have a short lift span. In almost all cases, the thermal will “spit” the balloon out the top after a short time, and the pilot may descend and land as necessary.
Mechanical
When the air near the surface of the Earth flows over obstructions, such as irregular terrain, (bluffs, hills, mountains) and buildings, the normal horizontal wind flow is disturbed. As a result, it is transformed into eddies or other irregular air movements. Figure 4-21 shows how the buildings or other obstructions near a launch site or landing field can cause turbulence.
The strength and magnitude of mechanical turbulence depends on:
- The speed of the wind,
- The nature of the obstruction,
- The stability of the air, and
- The angle at which the wind moves over the obstacle.
Stability seems to be the most important factor in determining the strength and vertical extent of the mechanical turbulence.
Frontal
Frontal turbulence is cause by the lifting of warm air by a frontal surface, leading to instability and/or the mixing or

Figure 4-21. Surface obstructions cause eddies and other irregular air movements.
shear between the warm and cold air masses. The vertical currents in the warm air are strongest when the warm air is moist and unstable. The most severe cases of frontal turbulence are generally associated with fast moving cold fronts. In these cases, mixing between the two air masses, as well as the differences in wind speed and/or direction add to the intensity of the turbulence.
Wind Shear
Wind shear is a relatively steep gradient in wind velocity along a given line of direction (either vertical or horizontal) and produces churning motions (eddies) which result in turbulence. The greater the change of wind speed and/or direction in the given direction, the greater the shear and associated turbulence. Clear-air turbulence (CAT), or sudden severe turbulence that occurs in cloudless regions, is associated with wind shear, particularly between the core of a jet stream and the surrounding air. CAT is not limited to the vicinity of the jet stream and may occur in isolated regions of the atmosphere. For example, the turbulence in a mountain wave can also be classified as CAT because the identifying clouds in the wave do not necessarily have to occur for the turbulence to be present.
Sometimes during a climb or descent, a balloon encounters a narrow zone of wind shear with its accompanying turbulence at the top of a temperature inversion. These inversions occur anywhere from just above the surface to the tropopause.
Strong inversions near the ground are an extreme form of wind shear that adversely affect balloon takeoffs and landings. For example, a pocket of calm, cold air forms in a valley as a result of nighttime cooling, but the warmer air moving over it has not been affected appreciably. Due to the difference between the two bodies of air, a narrow layer of very turbulent air may form. A balloon climbing or descending through this zone will usually encounter considerable turbulence, as well as changes in lift.
Low Level Wind Shear
Wind shear is a sudden, drastic change in windspeed and/or direction over a very small area. Wind shear can subject a balloon to violent updrafts and downdrafts, as well as abrupt changes to the horizontal movement of the balloon. While wind shear can occur at any altitude, low level wind shear is especially hazardous due to the proximity of a balloon to the ground. Directional wind changes of 180° and speed changes of 50 knots or more are associated with low level wind shear. Low level wind shear is commonly associated with passing frontal systems, thunderstorms, and temperature inversions with strong upper level winds (greater than 25 knots).
Wind shear is hazardous to a balloon for several reasons. The rapid changes in wind direction and velocity changes the wind’s relation to the balloon disrupting the normal flight attitude and performance of the balloon.
Obstructions and Wind
As mentioned earlier, obstructions on the ground affect the flow of wind and can be an unseen danger, causing yet another atmospheric hazard for pilots. For example, ground topography and large buildings can break up the flow of the wind and create wind gusts that change rapidly in direction and speed. Obstructions range from manmade structures, such as hangars, to large natural obstructions, such as mountains, bluffs, or canyons. A safe pilot is vigilant when flying in or out of launch or landing sites that have large buildings or natural obstructions located near them. The intensity of the turbulence associated with ground obstructions depends on the size of the obstacle and the primary velocity of the wind. This can affect the takeoff and landing performance of a balloon, and can present a very serious hazard. During the landing phase of flight, a balloon may “drop in” due to the turbulent air and be too low to clear obstacles during the approach. Disrupted airflow often extends horizontally as much as ten times the height of the object, if the winds are in the eight to ten knot range. Balloon pilots should be aware of this, and make adjustments accordingly when attempting to launch next to an obstruction, or when landing just past one.
This same condition is even more noticeable when flying in mountainous regions. While the wind flows smoothly up the windward side of the mountain and the upward currents help to carry an aircraft over the peak of the mountain, the wind on the leeward side does not act in a similar manner. As the air flows down the leeward side of the mountain, the air follows the contour of the terrain and is increasingly turbulent. This tends to push an aircraft into the side of a mountain. The stronger the wind, the greater the downward pressure and turbulence become.
Due to the effect terrain has on the wind in valleys or canyons, downdrafts may be severe. Thus, a prudent balloonist is well advised to seek out another balloon pilot with mountain flying experience and get a mountain “checkout” before conducting a flight in or near mountainous terrain.
Mountain Wave
A mountain wave is the wavelike effect, characterized by updrafts and downdrafts, that occurs above and behind a mountain range when rapidly flowing air encounters the mountain range’s steep front. The characteristics of a typical mountain wave are represented in Figure 4-22 which illustrates how air flows with relative smoothness in its lifting component as the wave current moves along the windward side of the mountain. Wind speed gradually increases, reaching a maximum near the summit. On passing the crest, the flow breaks into a much more complicated pattern, with downdrafts predominating.
An indication of the possible intensities in the mountain wave is reflected in verified records of sustained downdrafts and updrafts in excess of 3,000 feet per minute (fpm). Turbulence in varying degrees can be expected, with particularly severe turbulence in the lower levels. Proceeding downwind 5 to 10 miles from the summit, the airflow begins to ascend as part of a definite wave pattern. Additional waves, generally less intense than the primary wave, may form downwind. This event is much like the series of ripples that form downstream from a rock submerged in a swiftly flowing river. The distance between successive waves (wavelength) usually ranges from 2 to 10 miles, depending on existing wind speed and atmospheric stability, although waves up to 20 miles apart have been reported.
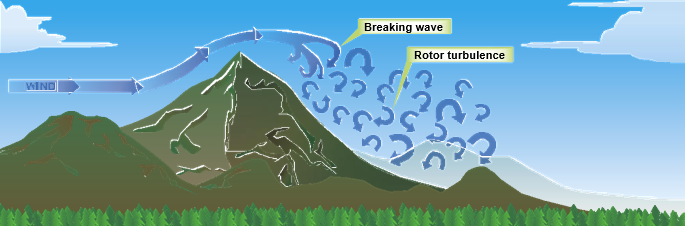
Figure 4-22. Characteristics of a mountain wave.
Characteristic cloud forms peculiar to wave action provide the best means of identification. Lenticular clouds, formed by mountain waves, are smooth in contour. [Figure 4-23] These clouds may occur alone or in layers at heights above 20,000 feet MSL, and be quite ragged when the airflow at that level is turbulent. The roll cloud forms at a lower level, generally near the height of the mountain ridge. The cap cloud must always be avoided in flight because of turbulence, concealed mountain peaks, and strong downdrafts on the lee slope. The lenticulars, like the roll and cap clouds, are stationary. They are constantly forming on the windward side and dissipating on the lee side of the mountain wave.
Rotors
Rotors or eddies can also be found embedded in mountain waves. Formation of rotors can also occur as a result of down slope winds. Their formation usually occurs where wind speeds change in a wave or where friction slows the wind near the ground. These rotors are often experienced as gusts or wind shear. Clouds may also form within a rotor.

Figure 4-23. Multiple lenticular clouds over Mount Shasta, California.
Research on mountain waves and rotors or eddies continues, but there is no doubt that pilots need to be aware of these phenomena and take appropriate precautions. Although mountain wave activity is normally forecast, many local factors may affect the formation of rotors and eddies. When planning a flight, a pilot should take note of the winds and terrain to assess the likelihood of waves and rotors. There may be telltale signs in flight, including disturbances on water or wheat fields and the formation of clouds, provided there is sufficient humidity to allow cloud formation.
Thunderstorms
A thunderstorm is a local storm produced by a cumulonimbus cloud and accompanied by lightning and thunder. Thunderstorms and cumulonimbus clouds contain many of the most severe atmospheric hazards for the balloon pilot. They are almost always accompanied by strong gusty winds, severe turbulence, heavy rain showers, and lightning. These hazards may extend well away from the central core of the thunderstorm mass, sometimes as much as 30 miles or more.
Ceilings and visibility in the precipitation areas under the thunderstorms are normally poor. Because of the heavy precipitation, the ceiling reported is at best an estimate of where the pilot may break out into visual contact with the surface. The weather observer determines the vertical visibility into the precipitation, which may be significantly different from the slant-range of the pilot.
Potentially hazardous turbulence, as well as many other hazards associated with thunderstorms, make a thunderstorm a dangerous weather formation. The safe balloon pilot avoids any conditions that may expose him or her to potential thunderstorm activity. He or she exercises discretion and good judgment when potential thunderstorm conditions exist.
Structure of Thunderstorms
Convective Cells
The fundamental structural element of the thunderstorm is the unit of convective circulation known as a convective cell. A mature thunderstorm contains one or more of these cells in different stages of development, each varying in diameter from one to five miles. By radar analysis and measurement of drafts, it has been determined that each cell is generally independent of surrounding cells in the same storm. Each thunderstorm progresses through a life cycle from 1 to 3 hours, depending upon the number of cells contained and their stage of development. In the initial stage (cumulus), the cloud consists of a single cell. As the development progresses, however, new cells may form as older cells dissipate.
Stages in Thunderstorm Development
The life cycle of each thunderstorm cell consists of three distinct stages:
- Cumulus,
- Mature, and
- Dissipating.
Cumulus Stage
Although most cumulus clouds do not become thunderstorms, the initial stage of a thunderstorm is always a cumulus cloud. [Figure 4-24] The chief distinguishing feature of the cumulus or building stage is an updraft that prevails throughout the entire cell. This updraft may vary from a few feet per second to as much as 6,000 fpm (65 knots) in mature cells. As an updraft continues through the vertical extent of the cell, water droplets grow in size and raindrops are formed.
Mature Stage
The beginning of surface rain and adjacent updrafts and downdrafts initiates the mature stage. [Figure 4-25] By this time, the average cell has attained a height of 25,000 feet. As the drops begin to fall, the surrounding air begins a downward motion because of frictional drag. This descending air will be colder that its surroundings and its rate of downward motion is accelerated, forming the downdraft. The downdraft reaches maximum speed a short time after rain begins to fall in the cloud. Downdrafts occur at all levels within the storm, and their speed ranges from a few feet per minute to about 2,500 fpm (25 knots). Significant downdrafts never extend from the top of the cell because moisture is not sufficient in the upper levels for raindrops to form. At these high levels, only ice crystals, snowflakes, and supercooled water are present. Therefore, their rate of fall is insufficient to cause appreciable downdrafts. The mature cell generally extends far above 25,000 feet—in some cases up to 70,000 feet. In the middle levels, around 14,000 feet, strong updrafts and downdrafts are

Figure 4-24. Congestive cumulus cloud.

Figure 4-25. Mature thunderstorm.
adjacent to each other. A shear action exists between these drafts and produces strong and frequent gusts.
Dissipating or Anvil Stage
Throughout the life span of the mature cell, more and more air aloft is entrained by the falling raindrops. Consequently, the downdraft spreads out to take the place of the weakening updrafts. As this process progresses, the entire lower portion of the cell becomes an area of downdraft. Since updrafts are necessary to produce condensation and release latent heat energy, the entire structure begins to dissipate.
[Figure 4-26] The strong winds aloft carry the upper section of the cloud into the familiar anvil form (cumulonimbus cloud). However, the appearance of the anvil does not always indicate that the thunderstorm is dissipating.

Figure 4-26. Dissipating thunderstorm.
A significant thunderstorm hazard is the rapid change in wind direction and wind speed immediately prior to storm passage at the surface. These strong winds are the result of the horizontal spreading of the storm’s downdraft current as they approach the surface of the earth. This initial wind surge, as observed at the surface, is known as a first gust. The speed of this first gust may exceed 75 knots and vary 180° in direction from the previously prevailing surface winds. First- gust speeds average about 15 knots over prevailing velocities, and average an approximately 40° change in the direction of the wind. First gusts usually precede the heavy precipitation, and strong gusts may continue for approximately 5 to 10 minutes with each thunderstorm cell. First gusts are not limited to the area ahead of the storm’s movement. They may be found in all sectors, including the area back of the storm’s movement.
During the passage of a thunderstorm, rapid and marked surface variations generally occur. These variations usually occur in a particular sequence characterized by:
- An abrupt fall in pressure as the storm approaches.
- An abrupt rise in pressure associated with rain showers as the storm moves on and the rain ceases.
All thunderstorms are similar in physical makeup, but for purposes of identification they are divided into two general groups: frontal and air mass. This division gives the balloon pilot an indication of the method by which the storms are formed and the distribution of the clouds over the area. The specific nomenclature of these thunderstorms depends upon the manner in which the lifting action occurs.
Frontal Thunderstorms Thunderstorms may occur within the cloud system of any front: warm, cold, stationary, or occluded. Frontal thunderstorms
are caused by the lifting of warm, moist, conditionally
unstable air over a frontal surface. Thunderstorms may also occur many miles ahead of a rapidly moving cold front, and are called prefrontal or squall line thunderstorms.
Warm front thunderstorms are caused when warm, moist, conditionally unstable air is forced aloft over a colder, denser shelf of retreating air. Because the frontal surface is shallow, the air is lifted gradually. The lifting condensation level is normally reached long before the level of free convection, thus producing stratiform clouds. The level of free convection is normally reached in isolated areas along the frontal surface. This is the area where the greatest amount of water vapor is present in the warm air being lifted. Therefore, warm front thunderstorms are generally scattered. When the level of free convection is reached, warm front thunderstorms may form. These thunderstorms may prove particularly hazardous, as they are frequently obscured by the surrounding stratiform clouds.
Cold front thunderstorms are caused by the forward motion of a wedge of cold air under a mass of warm, moist, conditionally unstable air (cold front), increasing the possibility for thunderstorms to develop. The slope of a typical cold frontal surface is relatively steep, so the lifting condensation level and the level of free convection are usually near the same altitude. Cold front thunderstorms are typically positioned along the frontal surface in what appears to be a continuous line. These storms are easily recognized from the air, because they are partly visible from the front and rear of the storm line. However, if the slope of the frontal surface is shallow, the lifting action is not sufficient to produce thunderstorms in lines (line squalls). With a shallow front, the thunderstorms form behind the surface front and are widely scattered. Such storms may be concealed by the surrounding cloud layers.
Lines of thunderstorms frequently develop ahead of rapidly moving cold fronts. These are known as prefrontal squall lines, and frequently form parallel to the cold front. Prefrontal squall line thunderstorms are usually more violent than cold front thunderstorms. They are most active between noon and midnight. The cold front cloud system usually weakens during the period of the greatest prefrontal squall line activity because the warm air displaced by the frontal surface has lost its moisture and energy in the prefrontal thunderstorms. In the United States, tornadoes are frequently associated with strong prefrontal squall lines. Pre-frontal squall line thunderstorms are indicated on a surface weather map by an alternate dash-dot-dash line (display).
The distribution of stationary front thunderstorms is controlled by the slope of the frontal surface. Steeply sloped stationary fronts tend to have lines of storms, whereas shallow stationary fronts tend to have widely scattered storms.
Occluded front thunderstorms are associated with the two types of occluded fronts (warm front and cold front occlusions), and are usually cold front thunderstorms that have been moved into the area of warm frontal weather by the occlusion process. They are found along the upper front, and are normally strongest for a distance of 50 to 100 miles north of the peak of the warm sector.
Air Mass Thunderstorms
The two types of air mass thunderstorms are locally convective and orographic. Both types form within air masses, and are randomly distributed throughout the air mass.
Convective thunderstorms are often caused by solar heating of the land, which provides heat to the air, thereby resulting in thermal convection. Relatively cool air flowing over a warmer water surface may also produce sufficient convection to cause thunderstorms. The land-type convective thunderstorms normally form during the afternoon hours, after the Earth has gained maximum heating from the sun. If cool, moist, conditionally unstable air is passing over this land area, heating from below will cause convective currents, thereby resulting in towering cumulus or thunderstorm activity. Dissipation usually occurs during the early evening hours, as the land begins to lose its heat to the atmosphere. Although convective thunderstorms form as individual cells, they may become so numerous over a particular geographical area that continued flight cannot be maintained.
Thunderstorms over the ocean are most common during the night and early morning. They frequently occur offshore when a land breeze is blowing toward the water. The cool land breeze is heated by the warmer water surface, which results in sufficient convection to produce thunderstorms. After sunrise, heating of the land surface reverses the airflow (sea breeze). The thunderstorms then dissipate over the water, but they may re-form over the warmer land surface. As an example, the air mass weather that exists in Florida combines both types of convective thunderstorms. Circulation around a semipermanent high pressure system off the southeastern United States (Bermuda high) carries moist ocean air over the warm land surface of the Florida Peninsula. At night, thunderstorms off the Florida Coast are caused by the warm water of the Gulf Stream heating the surface air, while the upper air is cooling by radiation to space. This heating from below produces thermal convection over the water. When the sun rises, the heat balance necessary to maintain storm formation over the water is destroyed. By day, the storms appear to move inward over the land areas, but actually dissipate off the coast and re-form over the hot landmass. The heated land surface sets up an unstable lapse rate over the Peninsula and causes storm development to continue until nocturnal cooling occurs. Usually, convective type storms are randomly distributed and easily recognized.
Orographic thunderstorms will form on the windward side of a mountain if conditionally unstable air is lifted above the level of free convection. The storm activity is usually scattered along the individual peaks of the mountains. Occasionally, however, this activity may form a long unbroken line of storms similar to a squall line. The storms persist as long as the circulation causes upslope motion. From the windward side of the mountains, identification of orographic storms may sometimes be difficult because the storm clouds are obscured by other clouds (usually stratiform). Almost without exception, orographic thunderstorms enshroud mountain peaks or hills.
Minimum Factors
The minimum factors essential to the formation of a thunderstorm are conditionally unstable air with relatively high moisture content and some type of lifting action. Lifting of warm air will not necessarily cause free convection. The air may be lifted to a point where the moisture condenses and clouds form. These cloud layers, however, will be stable if the level of free convection has not been reached by the lifting. Conversely, it is possible for dry heated air to rise convectively without the formation of clouds. In this condition, turbulence might be experienced in perfectly clear weather. Cumulonimbus cloud formations require a combination of conditionally unstable air, some type of lifting actions, and high moisture content. Once a cloud has formed, the latent heat of condensation released by the change of state from vapor to liquid tends to make the air more unstable.
Some type of external lifting action is necessary to bring the warm surface air to the point where it will continue to rise freely (the level of free convection). For example, an air mass may be lifted by thermal convection, terrain, fronts, or convergence.
Summary
By no means is the information contained here a complete discussion of all the weather information and factors affecting balloon flight. There are many resources available, both through government and private agencies, which may be of value to the pilot in planning a flight. A pilot should take the time to explore the internet, read weather books, and gain a complete understanding of the myriad of weather information and products that are available.
The second section of this chapter will expose the reader to some of the weather reporting products available, both through FSS briefings and Internet searches. With the knowledge gained from the first half of this chapter, the pilot will be able to make a good interpretation of the reports, and determine how present and future conditions will affect the decision to fly.
How to Obtain Weather Information
An integral part of flight preparation for any pilot is checking the weather conditions expected to occur during the flight. FAA regulations place the responsibility for flight planning on the pilot. To effectively plan a flight, a pilot needs to understand what weather information is available, how to obtain it, and how it can be applied to a flight.
While weather forecasts are not 100 percent accurate, meteorologists, through careful scientific study and computer modeling, have the ability to predict the weather patterns, trends, and characteristics with increasing accuracy. Through a complex system of weather services, government agencies, and independent weather observers, pilots and other aviation professionals receive the benefit of this vast knowledge base in the form of up-to-date weather reports and forecasts. These reports and forecasts enable pilots to make informed decisions regarding weather and flight safety.
Sources for Weather Information
There are many sources available for today’s pilot when gathering information about weather prior to a flight. A review of pertinent weather reports and information is required by FAA regulations and the following sources provide excellent weather information. For the balloon pilot, experience and study helps him or her determine the preferred sources for weather information.
FAA Flight Service Stations (FSS)
The FAA FSS is the primary source for preflight weather information. FSS can be contacted by calling 1-800- WXBRIEF. It also logs pilot contacts to provide background information in the event of an accident or incident, as well as substantiating workload statistics. It is one of the two sources of an official weather briefing. Although there are currently 44 FSS operations, the FAA plans to automate the service and reduce the physical locations eventually to three. Due to this, occasional extended wait times can occur, particularly during periods of marginal or severe weather. To facilitate the process, inform the briefer prior to the start of the briefing of the information needed.
Internet Sources
A wealth of internet sources exist for the balloon pilot seeking information about current weather conditions.
- Direct User Access Terminal Service (DUATS) (www. duats.com—probably the most well-known of the many internet based weather sites, DUATS provides an on-line “official” briefing service at no cost to the aviation community. The site is a contracted function of the FAA, and is available to anyone who registers. Besides the normal briefing that can be received from the FSS, there are a number of graphic products available that enhance the user’s understanding of current and forecast weather.
- National Oceanic and Atmospheric Administration (NOAA) (www.noaa.gov)—NOAA operates the National Weather Service (NWS) at www.nws.noaa. gov which provides access to weather information collected on a continuing basis throughout the country.
NOAA also offers pilots an interactive page at www. weather.gov/view/largemap.php that is activated on a state-by-state basis and provides hourly weather observations at selected points. [Figure 4-27] This weather information helps a pilot determine trends in winds and pressure systems, which are prime indicators of general conditions for balloon pilots.

Figure 4-27. This map can be used to gather hourly AWOS and ASOS type weather information from various sites in each state.
- National Center for Atmospheric Research and the University Corporation for Atmospheric Research (www.ucar.edu)—a collaborative effort of research centers, universities, and weather offices around the United States, this site provides numerous real-time and forecast weather products and graphics.
- Aviation Digital Data Services (ADDS) (www. aviationweather.gov)—the Aviation Digital Data Service (ADDS) makes text, digital and graphical forecasts, analyses, and observations of aviation- related weather variables available to the aviation community. The ADDS graphics and charts are often easier to interpret than those of the AWC website.
- Helicopter Emergency Medical Services (HEMS) Weather Display (www.weather.aero/hems)—the ADDS development team created an experimental tool designed to show weather conditions for short-distance and low-altitude flights common for the helicopter emergency medical services (HEMS) community at the request of the FAA. [Figure 4-28] This interactive site allows the user to determine ceiling and visibility and winds (at 500 foot increments) for an area as small as 5k2. While not specifically targeted nor designed for the balloon pilot’s use, the information obtained from this site is helpful to the pilot planning a flight at some distance from a normal weather reporting facility.
Interpreting Weather Charts and Reports
A weather chart is any chart or map that presents data and analysis that describe the state of the atmosphere over an extended region at a given time. Weather charts provide a picture of the overall movement of major weather systems and fronts and are used in flight planning.
Three useful weather charts for balloon pilots are: surface analysis, weather depiction, and radar summary charts. These three charts present current weather information and provide “big picture” information for weather systems across the United States. The composite moisture stability chart, constant pressure analysis charts, and significant weather prognostic charts provide additional information for flight planning. Knowledge of all these weather charts, reports, and forecasts may not be necessary for the pilot planning a local flight, but an understanding of large scale weather patterns and systems bring a greater understanding of how those systems affect local weather. It is important to gain an understanding of the primary charts used, and develop interpolation skills to be able to perform safe, adequate flight planning.
Surface Analysis Chart
The surface analysis chart is computer-generated, covers the contiguous 48 states and adjacent areas, and is transmitted every 3 hours with an analysis of the current surface weather. It shows the areas of high and low pressure, fronts, temperatures, dew points, wind directions and speeds, local weather, and visual obstructions. [Figure 4-29]
Surface weather observations for reporting points across the United States are also depicted on this chart. Each of these reporting points is illustrated by a station model.
- Type of observation—a round model indicates an official weather observer made the observation. A square model indicates the observation is from an automated station. Stations located offshore give data from ships, buoys, or offshore platforms.
- Sky cover—the station model depicts total sky cover and will be shown as clear, scattered, broken, overcast, or obscured/partially obscured.
- Clouds—cloud types are represented by specific symbols. Low cloud symbols are placed beneath the station model, while middle and high cloud symbols are placed directly above the station model. Typically, only one type of cloud will be depicted with the station model.
- Sea level pressure—sea level pressure given in three digits to the nearest tenth of a mb. For 1,000 mb or greater, prefix a ten to the three digits. For less than 1,000 mb, prefix a nine to the three digits.
- Pressure change/tendency—pressure change in tenths of mb over the past 3 hours. This is depicted directly below the sea level pressure.
- Precipitation—a record of the precipitation that has fallen over the last 6 hours to the nearest hundredth of an inch.
- Dew point—dew point is given in degrees Fahrenheit.
- Present weather—over 100 different weather symbols are used to describe the current weather.
- Temperature—temperature is given in degrees Fahrenheit.
- Wind—true direction of wind is given by the wind pointer line, indicating the direction from which the wind is coming. A short barb is equal to five knots of wind, a long barb is equal to ten knots of wind, and a pennant is equal to 50 knots.

Figure 4-28. Example of the information found on the Helicopter Emergency Medical Services (HEMS) weather display site.

Figure 4-29. Example of a section of a surface analysis chart with station model legend (inset).
Weather Depiction Chart
A weather depiction chart details surface conditions as derived from METAR and other surface observations. It is prepared and transmitted by computer every 3 hours beginning at 0100 Zulu time (0100Z), and is valid at the time of the plotted data. Designed to be used for flight planning, it gives an overall picture of the weather across the United States. [Figure 4-30]
The weather depiction typically displays major fronts or areas of high and low pressure. It also provides a graphic display of Instrument Flight Rules (IFR), VFR, and marginal VFR (MVFR) weather. Areas of IFR conditions (ceilings less than 1,000 feet and visibility less than 3 miles) are shown by a hatched area outlined by a smooth line. MVFR regions (ceilings 1,000 to 3,000 feet, visibility 3 to 5 miles) are shown by a non-hatched area outlined by a smooth line. Areas of VFR (no ceiling or ceiling greater than 3,000 feet and visibility greater than 5 miles) are not outlined. Weather depiction charts show a modified station model that provides sky conditions in the form of total sky cover, cloud height or ceiling, weather, and obstructions to visibility, but does not include winds or pressure readings like the surface analysis chart. A bracket ( ] ) symbol to the right of the station indicates the observation was made by an automated station.

Figure 4-30. Weather depiction chart.
A detailed explanation of a station model is depicted in the previous discussion of surface analysis charts.
Radar Summary Chart (SD)
A radar summary chart [Figure 4-31] is a computer-generated graphical display of a collection of automated radar weather reports (SDs). The chart is published hourly, 35 minutes past the hour. It displays areas of precipitation as well as information regarding the characteristics of the precipitation. An SD chart includes:
- No information—if information is not reported, the chart will read “NA.” If no echoes are detected, the chart will read “NE.”
- Precipitation intensity contours—intensity can be described as one of six levels and is shown on the chart by three contour intervals.
- Height of tops—the heights of the echo tops are given in hundreds of feet MSL.
- Movement of cells—individual cell movement is indicated by an arrow pointing in the direction of movement. The speed of movement in knots is the number at the top of the arrow head. “LM” indicates little movement.

Figure 4-31. Radar summary chart.
- Type of precipitation—the type of precipitation is marked on the chart using specific symbols.
- Echo configuration—echoes are shown as areas, cells, or lines.
- Weather watches—severe weather watch areas for tornadoes and severe thunderstorms are depicted by boxes outlined with heavy dashed lines.
A valuable tool for preflight planning, the SD chart has several limitations. Since it depicts only areas of current precipitation, it will not show areas of clouds and fog with no appreciable precipitation, or the height of the tops and bases of the clouds. SD charts should be used in conjunction with current METAR and weather forecasts.
Composite Moisture Stability Chart
The composite moisture stability chart is a chart composed of four panels depicting stability, precipitable water, freezing level, and average relative humidity conditions. This computer-generated chart contains data obtained from upper-air observations, is updated twice a day, and shows the relative stability of the air mass and the potential for thunderstorms or thermal activity.
Stability/Lifted Index Chart
A subdisplay of the composition moisture stability chart is the stability or lifted index (LI) chart, a valuable tool for determining the stability of the atmosphere. The stability or LI chart is the upper left hand panel of the composite moisture stability chart. Two indexes represent the moisture and stability of the air: the K index (KI) and the LI, with these numbers composing a fraction. KI (denominator of the fraction) provides moisture and stability information. Values range from high positive values to low negative values. A high positive KI indicates moist, unstable air. KI values are considered high when at or above +20, and low when less than +20. [Figure 4-32]
The LI (numerator of the fraction) is a common measure of atmospheric stability. It is calculated by hypothetically lifting a parcel of air to the 500 mb level, approximately 18,000 feet MSL, and analyzing its stability at that level. A positive LI indicates that a particular parcel of air is stable and resists further upward motion. Large positive values (+8 or greater) would indicate very stable air. Conversely, a negative LI means that a lifted surface parcel of air is unstable, and more likely to rise. Large negative values (–6 or more) indicate very unstable air.

Figure 4-32. Lifted index chart.
The KI and LI can be used together to determine the moisture and stability characteristics of a particular air mass. The air masses may be classified as moist and stable, moist and unstable, dry and stable, or dry and unstable. This determination allows the balloon pilot to make an informed decision regarding the likelihood of thermal and potential thunderstorms, and if a safe flight can be conducted.

Figure 4-33. Constant pressure analysis chart.
Constant Pressure Analysis Charts
A constant pressure analysis chart or isobaric chart is a weather map representing conditions on a surface of equal atmospheric pressure. [Figure 4-33] For example, a 500 mb chart will display conditions at the level of the atmosphere at which the atmospheric pressure is 500 mb. The height above sea level at which the pressure is that particular value may vary from one location to another at any given time, and also varies with time at any one location, so it does not represent a surface of constant altitude/height.
Constant pressure charts provide the pilot with a clearer picture of how the atmosphere behaves at different altitudes and pressures. For example, a low pressure system that seems insignificant based on surface observations may prove to be a major factor in the weather at five or ten thousand feet.
Constant pressure charts are prepared for selected values of pressure and present weather information at various altitudes. Standard charting values are at 850 mb (approximately 5,000 feet MSL), 700 mb (approximately 10,000 feet MSL), 500 mb (approximately 18,000 feet MSL), as well as higher and lower altitudes. Charts with higher pressure altitudes present information at lower altitudes, and charts with lower pressure altitudes present information at higher altitudes.
Symbology on the constant pressure analysis chart is the same as that of the surface analysis chart. This chart depicts the information at a specific pressure altitude. When compared with the surface analysis of the same time frame, a three-dimensional concept of the atmosphere can be conceptualized, and the pilot can gain a greater understanding of the atmospheric dynamics involved in weather patterns.
Significant Weather Prognostic Charts
Significant weather prognostic charts [Figure 4-34] display the observed or forecast significant weather phenomena at different flight levels that may affect the operation of aircraft. They are available for low-level significant weather from the surface to FL 240 (24,000 feet), also referred to as the 400 mb level, and high-level significant weather from FL 250 to FL 600 (25,000 to 60,000 feet). This discussion involves the low-level significant weather prognostic chart. The low-level chart comes in two forms: the 12- and 24-hour forecast chart, and the 36- and 48-hour surface only forecast chart. The first chart is a four-panel chart that includes 12- and 24-hour forecasts for significant weather and surface weather. Charts are issued four times a day at 0000Z, 0600Z, 1200Z, and 1800Z. The valid time for the chart is printed on the lower
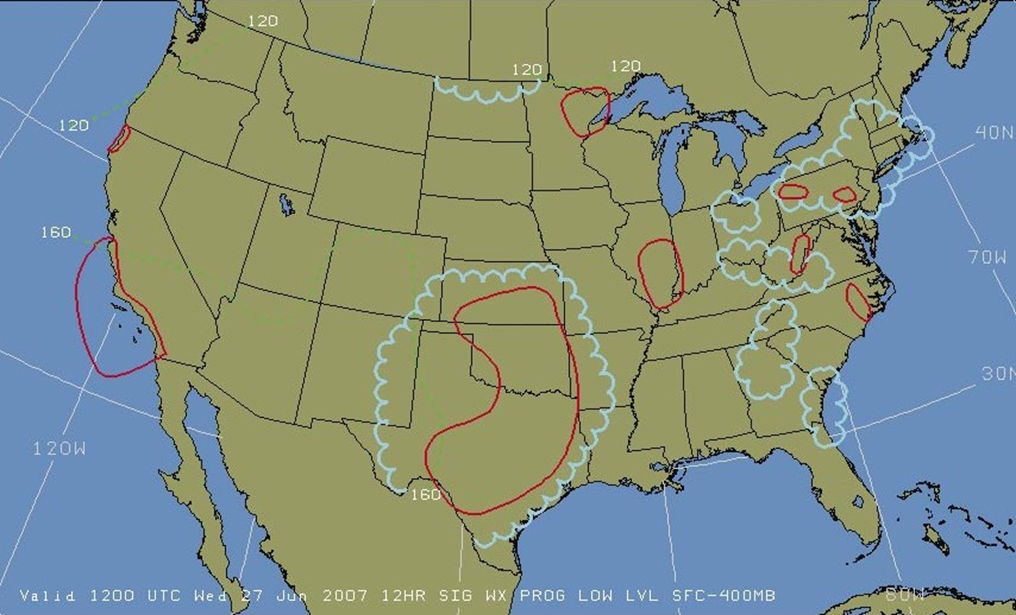
Figure 4-34. Significant weather prognostic chart.
left corner of each panel. The upper two panels show forecast significant weather, which may include nonconvective turbulence, freezing levels, and IFR or MVFR weather. Areas of moderate or greater turbulence are enclosed in dashed lines. Numbers within these areas give the height of the turbulence in hundreds of feet MSL. Figures below the line show the anticipated base, while figures above the line show the top of the zone of turbulence. Also shown on this panel are areas of VFR, IFR, and MVFR. IFR areas are enclosed by solid lines, MVFR areas are enclosed by scalloped lines, and the remaining, unenclosed area is designated VFR. Zigzag lines and the letters “SFC” (surface) indicate freezing levels in that area are at the surface. Freezing level height contours for the highest freezing level are drawn at 4,000 foot intervals with dashed lines.
Additional Weather Information
Skew-T Plots
Most weather information is derived from radiosondes, or weather balloons, that are released from over 100 stations in the United States twice daily (00Z and 12Z). The observations of temperature and humidity at various pressure altitudes are transmitted back to the releasing station; the radiosondes are also tracked by radar in order to determine wind speed and direction. This information is plotted to create a diagram known as a Skew-T/Log-P plot, commonly referred to as a Skew-T. These plots can be found at many different online weather sites; perhaps the easiest to use is rucsoundings.noaa. gov. The appropriate plot for any of the reporting sites can be found by typing in the closest reporting station identifier (usually an airport), and allowing the graphic to load.
There is a wealth of information that may be derived from the Skew-T plot (or “sounding,” as it may be referred to), but this discussion will be limited to those features of immediate interest to the average balloon pilot.
Some of the information that may be derived from the Skew- T, using the example in Figure 4-35:
- The two lines running vertically through the center of the graphic (red and blue) show the temperature and dew point at ascending pressure altitudes. The temperature is always plotted to the right of the dew point because temperature is almost always greater than the dew point temperature.
- The right side margin shows wind speed and direction, using the standard “barbed” system common in weather reporting. The scale (in this case, 0 to 40 knots) can be changed, but this setting provides the best resolution.
- The left margin of the chart indicates the pressure altitude for a particular reading. Pressure altitude readings correspond generally to certain altitudes. For example, the reading at 850 mb equates roughly to an

Figure 4-35. Example of a Skew-T plot.
altitude of 5,000 feet above MSL. That may not appear to be useful; however, this is where the dynamics of the application come into play. If the computer cursor is moved over the graphic part of the diagram, indicators as to the specific information for that altitude may be seen (not depicted in Figure 4-35). A pilot may be able to get information for varying altitudes as close at 125 feet apart, depending on the resolution of the original sounding information.
There is a tutorial available to fully explain the data interpretation of the Skew T plot at www.met.tamu.edu/class/ ATMO151/tut/sound/soundmain.html.
Velocity Azimuth Display (VAD)Winds
Velocity Azimuth display (VAD) winds are derived from the output of the 160 WSR-88 radar sites located throughout the United States. These radar systems are used by weather professionals to produce many different products, including the weather radar depictions found on many of the web sites previously discussed, as well as various television station weather reporting. [Figure 4-36]
The WSR-88 radar systems can be configured to produce radar returns from dust and other particulate matter that may be in the air. These radar returns can be processed to indicate wind direction and speed at different altitudes. VAD winds are generally reported in 1,000 foot increments, although at

Figure 4-36. VAD wind graphic.
times reports may be as small as 150 feet between altitudes. Standard “wind barb” depictions are used to represent the wind direction and speed at different altitudes.
Plymouth State University in Plymouth, New Hampshire operates a Weather Center with a website for locating VAD winds. This user-friendly website offers pilots a convenient selection of reporting stations at http://vortex.plymouth. edu/lnids_conus.html.
Aviation Forecasts
Observed weather condition reports are often used in the creation of forecasts for the same area. A variety of different forecast products are produced and designed to be used in the preflight planning stage. Pilots need to be familiar with the following printed forecasts: wind and temperature aloft forecasts (FD reports), the terminal aerodrome forecast (TAF), aviation area forecast (FA), and inflight weather advisories (SIGMET, AIRMET).
Wind and Temperature Aloft Forecast (FD Report) Wind and temperature aloft forecasts provide wind and temperature forecasts for specific locations in the contiguous United States, plus network locations in Hawaii and Alaska.
The forecasts are made twice a day based on the radiosonde upper air observations taken at 0000Z and 1200Z. Up through 12,000 feet are true altitudes; at and above 18,000 feet are pressure altitudes. Wind direction is always in reference to true north, and wind speed is given in knots. The temperature is given in degrees Celsius; no winds are forecast when a given level is within 1,500 feet of the station elevation. Similarly, temperatures are not forecast for any station within 2,500 feet of the station elevation. If the wind speed is forecast to be greater than 100 knots but less than 199 knots, the computer adds 50 to the direction and subtracts 100 from the speed. A sample FD report is shown in Figure 4-37.
To decode this type of data group, the reverse process must be accomplished. For example, when the data appears as “731960,” subtract 50 from the 73 and add 100 to the 19; the wind would be 230° at 119 knots with a temperature of
–60°C. If the wind speed is forecast to be 200 knots or greater, the wind group is coded as 99 knots. When the data appears as “7799,” subtract 50 from 77 and add 100 to 99; the wind is 270° at 199 knots or greater. When the forecast wind speed is calm or less than 5 knots, the data group is coded “9900,” which means light and variable.
Aviation Routine Weather Report (METAR)
METAR is an observation of current surface weather reported in a standard international format. While the METAR code has been adopted worldwide, each country is allowed to make

Figure 4-37. Sample FD report.
modifications to the code. This discussion of METAR will cover elements used in the United States.
Example:
METAR KGGG 161753Z AUTO 14021G26 3/4SM +TSRA BR BKN008 OVC012CB 18/17 A2970 RMK PRESFR
A typical METAR report contains the following information in sequential order:
- Type of report—the first of two types of METAR reports is the routine METAR report that is transmitted every hour. The second is the aviation selected special weather report (SPECI). This is a special report that can be given at any time to update the METAR for rapidly changing weather conditions, aircraft mishaps, or other critical information.
- Station identifier—each station is identified by a four- letter code as established by the International Civil Aviation Organization (ICAO). In the 48 contiguous states, a unique three-letter identifier is preceded by the letter “K.” For example, Gregg County Airport in Longview, Texas, is identified by the letters “KGGG,” K being the country designation and GGG being the airport identifier. In other regions of the world, including Alaska and Hawaii, the first two letters of the four-letter ICAO identifier indicate the region, country, or state. Alaska identifiers always begin with the letters “PA” and Hawaii identifiers always begin with the letters “PH.” A list of station identifiers can be found at an FSS or NWS office or online at www. eurocontrol.int/icaoref/.
- Date and time of report—are depicted in a six-digit group (e.g., 161753Z). The first two digits of the six- digit group are the date. The last four digits are the time of the METAR, which is always given in Coordinated Universal Time (UTC). A “Z” is appended to the end of the time to denote the time is given in Zulu time (UTC) as opposed to local time.
- Modifier—denotes that the METAR came from an automated source or that the report was corrected. If the notation “AUTO” is listed in the METAR, the report came from an automated source. It also lists “AO1” or “AO2” in the remarks section to indicate the type of precipitation sensors employed at the automated station. When the modifier “COR” is used, it identifies a corrected report sent out to replace an earlier report that contained an error (for example: METAR KGGG 161753Z COR).
- Wind—reported with five digits (e.g., 14021) unless the speed is greater than 99 knots, which requires six digits. The first three digits indicate the direction the wind is blowing in tens of degrees. If the wind is variable, it is reported as “VRB.” The last two digits indicate the speed of the wind in knots (KT) unless the wind is greater than 99 knots, which requires three digits. If the winds are gusting, the letter “G” follows the wind speed. After the letter “G,” the peak gust recorded is provided (e.g., 21G26). If the wind varies more than 60° and the wind speed is greater than 6 knots, a separate group of numbers, separated by a “V,” will indicate the extremes of the wind directions.
- Visibility—the prevailing visibility (e.g., 3/4 SM) is reported in statute miles as denoted by the letters “SM.” It is reported in both miles and fractions of miles. At times, runway visual range (RVR) is reported following the prevailing visibility. RVR is the distance a pilot can see down the runway in a moving aircraft. When RVR is reported, it is shown with an R, then the runway number followed by a slant, then the visual range in feet. For example, when the RVR is reported as R17L/1400FT, it translates to a visual range of 1,400 feet on runway 17 left.
- Weather—broken down into two different categories: qualifiers and weather phenomenon (e.g., +TSRA BR). First, the qualifiers of intensity, proximity, and the descriptor of the weather will be given. The intensity may be light (–), moderate ( ), or heavy (+). Proximity depicts only weather phenomena that are in the airport vicinity. The notation “VC” indicates a specific weather phenomenon is in the vicinity of 5 to 10 miles from the airport. Descriptors are used to describe certain types of precipitation and obscurations. Weather phenomena may be reported as being precipitation, obscurations, and other phenomena such as squalls or funnel clouds. Descriptions of weather phenomena as they begin or end, and hailstone size are also listed in the remarks sections of the report.
- Sky condition—always reported in the sequence of amount, height, and type or indefinite ceiling/height (vertical visibility) (e.g., BKN008 OVC012CB). The heights of the cloud bases are reported with a three-digit number in hundreds of feet above the ground. Clouds above 12,000 feet are not detected or reported by an automated station. The types of clouds, specifically towering cumulus (TCU) or cumulonimbus (CB) clouds, are reported with their height. Contractions are used to describe the amount of cloud coverage and obscuring phenomena. The amount of sky coverage is reported in eighths of the sky from horizon to horizon.
- Temperature and dew point—always given in degrees Celsius (e.g., 18/17). Temperatures below 0 °C are preceded by the letter “M” to indicate minus.
- Altimeter setting—reported as inches of mercury in a four-digit number group, and is always preceded by the letter “A” (e.g., A2970). Rising or falling pressure may also be denoted in the remarks sections as “PRESRR” or “PRESFR” respectively.
- Remarks—comments may or may not appear in this section of the METAR. The information contained in this section may include wind data, variable visibility, beginning and ending times of particular phenomenon, pressure information, and various other information deemed necessary. An example of a remark regarding weather phenomenon that does not fit in any other category would be: OCNL LTGICCG. This translates as occasional lightning in the clouds, and from cloud to ground. Automated stations also use the remarks section to indicate the equipment needs maintenance. The remarks section always begins with the letters “RMK.”
Example:
METAR BTR 161753Z 14021G26 3/4SM -RA BR BKN008 OVC012 18/17 A2970 RMK PRESFR
Explanation:
Type of Report Routine METAR
Location: Baton Rouge, Louisiana
Date: 16th day of the month
Time: 1753 Zulu
Modifier: None shown
Wind Information: 140° at 21 kts gusting to 26 kts Visibility: 3/4 statute mile
Weather: light rain and mist
Sky Conditions: Broken 800 ft, overcast 1,200 Temperature: 18 °C, dew point 17 °C
Altimeter: 29.70 “Hg
Remarks: Barometric pressure is falling.
Terminal Aerodrome Forecasts (TAF)
A terminal aerodrome forecast (TAF) is a report established for the five statute mile radius around an airport. TAF reports are usually given for larger airports. Each TAF is valid for a 24-hour time period, and is updated four times a day at 0000Z, 0600Z, 1200Z, and 1800Z. TAF utilizes the same descriptors and abbreviations as used in the METAR report.
The terminal forecast includes the following information in sequential order:
- Type of report—TAF can be either a routine forecast (TAF) or an amended forecast (TAF AMD).
- ICAO station identifier—The station identifier is the same as that used in a METAR.
- Date and Time of Origin—reported in a six-digit code. The first two indicate the date, the last four indicate the time. Time is always given in UTC as denoted by the “Z” following the number group.
- Valid period date and time—the valid forecast time period is reported in a six-digit number group. The first two numbers indicate the date, followed by the two-digit beginning time for the valid period, followed by the two digit ending time.
- Forecast Wind—the wind direction and speed forecast are reported in a five-digit number group. The first three digits indicate the direction of the wind in reference to true north. The last two digits state the windspeed in knots, as denoted by the letters “KT.” As in the METAR, winds greater than 99 knots are given in three digits.
- Forecast visibility—reported in statute miles, in whole numbers or fractions. If the forecast visibility is greater than 6 miles, it will be coded as “P6SM.”
- Forecast significant weather—weather phenomenon is coded in the TAF reports in the same format as the METAR. If no significant weather is expected during the forecast time period, the denotation “NSW” will be included in the “becoming” or “temporary” weather groups.
- Forecast sky condition—reported in the same manner as the METAR. Only cumulonimbus (CB) clouds are forecast in this portion of the TAF report as opposed to CBs and towering cumulus in the METAR.
- Forecast change group—for any significant weather change forecast to occur during the TAF time period, the expected conditions and time period are included in this group. This information may be shown as From (FM), Becoming (BECMG), and Temporary (TEMPO). “From” is used when a rapid and significant change, usually within an hour, is expected. “Becoming” is used when a gradual change in the weather is expected over a period of no more than 2 hours. “Temporary” is used for temporary fluctuations of weather, expected to last for less than an hour.
- Probability forecast—a given percentage that describes the probability of thunderstorms and precipitation occurring in the coming hours. This forecast is not used for the first 6 hours of the 24-hour forecast.
Example:
TAF KPIR 111130Z 111212 15012KT P6SM BKN090 TEMPO 1214 5SM BR
FM1500 16015G25KT P6SM SCT040 BKN250 FM0000 14012KT P6SM BKN080 OVC150 PROB40
0004 3SM TSRA BKN030CB
FM0400 1408KT P6SM SCT040 OVC080 TEMPO0408 3SM TSRA OVC030CB
BECMG 0810 32007KT=
Explanation:
Routine TAF for Pierre, South Dakota on the 11th day of the month, at 1130Z valid for 24 hours from 1200Z on the 11th to 1200Z on the 12th wind from 150° at 12 knots visibility greater than 6 statute miles, broken clouds at 9,000 feet, temporarily, between 1200Z and 1400Z, visibility 5 statute miles in mist.
From 1500Z, winds from 160° at 15 knots, gusting to 25 knots, visibility greater than 6 statute miles, clouds scattered at 4,000 feet and broken at 25,000 feet.
From 0000Z wind from 140° at 12 knots; visibility greater than 6 statute miles, clouds broken at 8,000 feet, overcast at 15,000 feet between 0000Z and 0400Z, there is 40 percent probability of visibility 3 statute miles thunderstorm with moderate rain showers clouds broken at 3,000 feet with cumulonimbus clouds.
From 0400Z winds from 140°at 8 knots visibility greater than 6 miles clouds at 4,000 scattered and overcast at 8,000 temporarily between 0400Z and 0800Z visibility 3 miles, thunderstorms with moderate rain showers clouds overcast at 3,000 feet with cumulonimbus clouds.
Becoming between 0800Z and 1000Z wind from 320° at 7 knots end of report (=).
Area Forecasts (FA)
The aviation area forecast (FA) gives a picture of clouds, general weather conditions, and visual meteorological conditions (VMC) expected over a large area encompassing several states. There are six areas for which area forecasts are published in the contiguous 48 states. Area forecasts are issued three times a day and are valid for 18 hours. This type of forecast gives information vital to en route operations as well as forecast information for smaller airports that do not have terminal forecasts.
Inflight Weather Advisories
Inflight weather advisories are forecasts provided to en route aircraft, and detail potentially hazardous weather. These advisories are also available to pilots prior to departure for flight planning purposes.
Airman’s Meteorological Information (AIRMET) AIRMETs (report type designator WA) are issued every 6 hours with intermediate updates issued as needed for a particular area forecast region. The information contained in an AIRMET is of operational interest to all aircraft, but the weather section concerns phenomena considered potentially hazardous to light aircraft and aircraft with limited operational capabilities. An AIRMET includes forecast of moderate icing, moderate turbulence, sustained surface winds of 30 knots or greater, widespread areas of ceilings less than 1,000 feet and/or visibilities less than 3 miles, and extensive mountain obscurities. Each AIRMET bulletin has a fixed alphanumeric designator, and is numbered sequentially for easy identification, beginning with the first issuance of the day. SIERRA is the AIRMET code used to denote IFR and mountain obscuration; TANGO is used to denote turbulence, strong surface winds, and low-level wind shear; and ZULU is used to denote icing and freezing levels.
Example:
DFWT WA 241650
AIRMET TANGO UPDT 3 FOR TURBC… STG SFC WINDS AND LLWS VALID UNTIL 242000 AIRMET TURBC… OK TX…UPDT FROM OKC TO DFW TO SAT TO MAF TO CDS TO OKC OCNL MDT TURBC BLO 60 DUE TO STG AND GUSTY LOW LVL WINDS. CONDS CONTG BYD 2000Z
Significant Meteorological Information (SIGMET) SIGMETs (report type designator WS) are inflight advisories concerning nonconvective weather that is potentially hazardous to all aircraft. They report weather forecasts that
include severe icing not associated with thunderstorms, severe or extreme turbulence or clear air turbulence (CAT) not associated with thunderstorms, dust storms, or sandstorms that lower surface or inflight visibilities to below 3 miles, and volcanic ash. SIGMETs are unscheduled forecasts that are valid for 4 hours, but if the SIGMET relates to hurricanes, it is valid for 6 hours.
A SIGMET is issued under an alphabetic identifier, from November through Yankee, excluding Sierra and Tango. The first issuance of a SIGMET is designated as a UWS, or Urgent Weather SIGMET. Re-issued SIGMETs for the same weather phenomenon are sequentially numbered until the weather phenomenon ends.
Example:
SFOR WS 100130 SIGMET ROME02 VALID UNTIL 100530 OR WA FROM SEA TO PDT TO EUG TO SEA OCNL MOGR CAT BTN 280 AND 350 EXPCD DUE TO JTSTR. CONDS BGNG AFT 0200Z CONTG BYD 0530Z.
Convective Significant Meteorological Information (WST)
A Convective SIGMET (WST) is an inflight weather advisory issued for hazardous convective weather that affects the safety of every flight. Convective SIGMETs are issued for severe thunderstorms with surface winds greater than 50 knots, hail at the surface greater than or equal to ¾ inch in diameter, or tornadoes. They are also issued to advise pilots of embedded thunderstorms, lines of thunderstorms, or thunderstorms with heavy or greater precipitation that affect 40 percent or more of a 3,000 square foot or greater region.
Convective SIGMETs are issued for each area of the contiguous 48 states but not Alaska or Hawaii. Convective SIGMETs are issued for the eastern (E), western (W), and central (C) United States. Each report is issued at 55 minutes past the hour, but special reports can be issued during the interim for any reason. Each forecast is valid for 2 hours. They are numbered sequentially each day from 1-99, beginning at 00 Zulu time. If no hazardous weather exists, the Convective SIGMET will still be issued; however, it will state “CONVECTIVE SIGMET…. NONE.”
Example:
MKCC WST 221855 CONVECTIVE SIGMET 21C VALID UNTIL 2055 KS OK TX
VCNTY GLD-CDS LINE NO SGFNT TSTMS RPRTD LINE TSTMS DVLPG BY 1955Z WILL MOV EWD 30-35 KT THRU 2055Z HAIL TO 2 IN PSBL
Pilot Weather Reports (PIREPs)
Pilot weather reports (PIREPs) provide valuable information regarding the conditions as they actually exist in the air, and cannot be gathered from any other source. Pilots can confirm the height of bases and tops of clouds, locations of wind shear and turbulence, and the location of inflight icing. If the ceiling is below 5,000 feet, or visibility is at or below 5 miles, ATC facilities are required to solicit PIREPs from pilots in the area. When unexpected weather conditions are encountered, pilots are encouraged to make a report to an FSS or ATC. When a pilot weather report is filed, the ATC facility or FSS will add it to the distribution system to brief other pilots and provide inflight advisories.
PIREPs are easy to file, and a standard reporting form outlines the manner in which they should be filed. Figure 11-4 shows the elements of a PIREP form. Item numbers 1 through 5 are required information when making a report, as well as at least one weather phenomenon encountered. PIREPs are normally transmitted as an individual report, but may be appended to a surface report. Pilot reports are easily decoded and most contractions used in the reports are self-explanatory.
Example:
UA/OV GGG 090025/ M 1450/ FL 060/ TP C182/ SK 080 OVC/ WX FV 04R/ TA 05/ WV 270030/ TB LGT/ RM HVY RAIN
Explanation:
Type: Routine pilot report
Location: 25 NM out on the 090° radial, Gregg County VOR
Time: 1450 Zulu
Altitude or Flight Level: 6,000 feet Aircraft Type: Cessna 182
Sky Cover: 8,000 overcast
Visibility/Weather: 4 miles in rain Temperature: 5° Celsius
Wind: 270° at 30 knots
Turbulence: Light
Icing: None reported
Remarks: Rain is heavy
Chapter Summary
A thorough understanding of the weather is a “make or break” item for the balloon pilot; without a complete picture of the weather, a pilot may make an ill-advised decision to launch that may result in injury, damage to the balloon, or worse. It is imperative that a pilot use as many resources as he can, understanding the variables potentially affecting flight, and making an informed decision to conduct a safe flight.
Perhaps the most valuable point to be made is that the balloon pilot must use and exercise common sense. When flying a balloon, the most desirable conditions are good visibility, light winds, and no precipitation. Anything other than that scenario should be reason to pause and consider the possible outcome of a launch. There is never an absolute requirement to fly—there is always the possibility of making the decision to try again another day.


