Introduction
The definition for airports refers to any area of land or water used or intended for landing or takeoff of aircraft. This includes, within the five categories of airports listed below, special types of facilities including seaplane bases, heliports, and facilities to accommodate tilt rotor aircraft. An airport includes an area used or intended for airport buildings, facilities, as well as rights of way together with the buildings and facilities.
Types of Airports
There are two types of airports—towered and non-towered. These types can be further subdivided to: • Civil Airports—airports that are open to the general public.
• Military/Federal Government airports—airports operated by the military, National Aeronautics and Space Administration (NASA), or other agencies of the Federal Government. • Private Airports—airports designated for private or restricted use only, not open to the general public.
Towered Airport
A towered airport has an operating control tower. Air traffic control (ATC) is responsible for providing the safe, orderly, and expeditious flow of air traffic at airports where the type of operations and/or volume of traffic requires such a service.
Non-towered Airport
A non-towered airport does not have an operating control tower. Two-way radio communications are not required, although it is a good operating practice for pilots to monitor other aircraft on the specified frequency for the benefit of other traffic in the area. The key to monitoring traffic at an airport without an operating control tower is selection of the correct common frequency. The acronym CTAF, which stands for Common Traffic Advisory Frequency, is synonymous with this program. A CTAF is a frequency designated for the purpose of carrying out airport advisory practices while operating to or from an airport without an operating control tower. The CTAF may be a Universal Integrated Community (UNICOM), MULTICOM, FSS, or tower frequency and is identified in appropriate aeronautical publications. UNICOM is a nongovernment air/ground radio communication station that may provide airport information at public use airports where there is no tower or FSS.
Non-towered airport traffic patterns are always entered at pattern altitude. How you enter the pattern depends upon the direction of arrival. The preferred method for entering from the downwind side of the pattern is to approach the pattern on a course 45 degrees to the downwind leg and join the pattern at midfield.
Sources for Airport Data
When a remote pilot operates in the vicinity of an airport, it is important to review the current data for that airport. This data provides the pilot with information, such as communication frequencies, services available, closed runways, or airport construction. Three common sources of information are:
- Aeronautical Charts
- • Chart Supplement U.S. (formerly Airport/Facility Directory)
- • Notices to Airmen (NOTAMs)
- • Automated Terminal Information Service (ATIS)
Chart Supplement U.S. (formerly Airport/Facility Directory)
The Chart Supplement U.S. (formerly Airport/Facility Directory) provides the most comprehensive information on a given airport. It contains information on airports, heliports, and seaplane bases that are open to the public. The Chart Supplement U.S. is published in seven books, which are organized by regions and are revised every 56 days. The Chart Supplement U.S. is also available digitally at www.faa.gov/air_traffic/flight_info/aeronav. Figure 11-1 contains an excerpt from a directory. For a complete listing of information provided in a Chart Supplement U.S. and how the information may be decoded, refer to the “Legend Sample” located in the front of each Chart Supplement U.S.
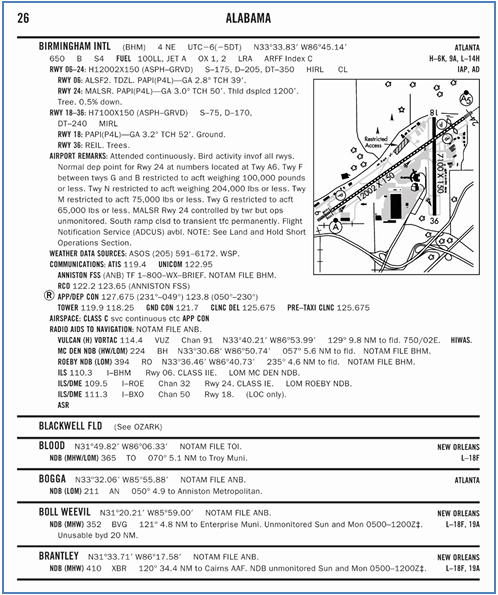
Figure 11-1. Chart Supplement U.S. (formerly Airport/Facility Directory excerpt.
Notices to Airmen (NOTAM)
Time-critical aeronautical information, which is of a temporary nature or not sufficiently known in advance to permit publication, on aeronautical charts or in other operational publications, that receives immediate dissemination by the NOTAM system. The NOTAM information could affect your decision to make the flight. Although NOTAMs contain information such as taxiway and runway closures, construction, communications, changes in status of navigational aids, and other information essential to planned en route, terminal, or landing operations, a remote pilot can use this information to help them make an informed decision about where and when to operate their small UA. Exercise good judgment and common sense by carefully regarding the information readily available in NOTAMs.
Prior to any flight, pilots should check for any NOTAMs that could affect their intended flight. For more information on NOTAMs, refer back to Chapter 2, “Airspace Classification, Operating Requirements, and Flight Restrictions,” of this study guide.
Automated Terminal Information Service (ATIS)
The Automated Terminal Information Service (ATIS) is a recording of the local weather conditions and other pertinent non-control information broadcast on a local frequency in a looped format. It is normally updated once per hour but is updated more often when changing local conditions warrant. Important information is broadcast on ATIS including weather, runways in use, specific ATC procedures, and any airport construction activity that could affect taxi planning.
When the ATIS is recorded, it is given a code. This code is changed with every ATIS update. For example, ATIS Alpha is replaced by ATIS Bravo. The next hour, ATIS Charlie is recorded, followed by ATIS Delta and progresses down the alphabet.
Aeronautical Charts
An aeronautical chart is the road map for a pilot. The chart provides information that allows remote pilots to obtain information about the areas where they intend to operate. The two aeronautical charts used by VFR pilots are:
• Sectional
• VFR Terminal Area
A free catalog listing aeronautical charts and related publications including prices and instructions for ordering is available at the Aeronautical Navigation Products website: www.aeronav.faa.gov.
Sectional Charts
Sectional charts are the most common charts used by pilots today. The charts have a scale of 1:500,000 (1 inch = 6.86 nautical miles (NM) or approximately 8 statute miles (SM)), which allows for more detailed information to be included on the chart.
The charts provide an abundance of information, including airport data, navigational aids, airspace, and topography. Figure 11-2 is an excerpt from the legend of a sectional chart. By referring to the chart legend, a pilot can interpret most of the information on the chart. A pilot should also check the chart for other legend information, which includes air traffic control (ATC) frequencies and information on airspace. These charts are revised semiannually except for some areas outside the conterminous United States where they are revised annually.
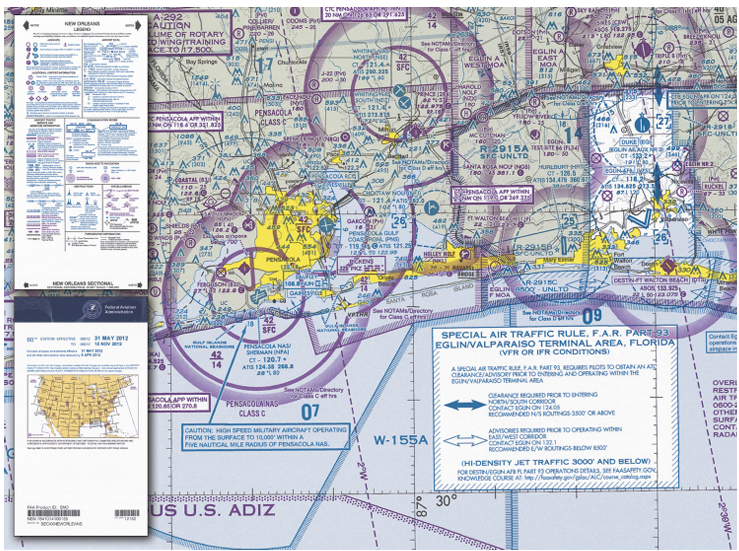
Figure 11-2. Sectional chart and legend.
Latitude and Longitude (Meridians and Parallels)
The equator is an imaginary circle equidistant from the poles of the Earth. Circles parallel to the equator (lines running east and west) are parallels of latitude. They are used to measure degrees of latitude north (N) or south (S) of the equator. The angular distance from the equator to the pole is one-fourth of a circle or 90°. The 48 conterminous states of the United States are located between 25° and 49° N latitude. The arrows in Figure 11-3 labeled “Latitude” point to lines of latitude. Meridians of longitude are drawn from the North Pole to the South Pole and are at right angles to the Equator. The “Prime Meridian,” which passes through Greenwich, England, is used as the zero line from which measurements are made in degrees east (E) and west (W) to 180°. The 48 conterminous states of the United States are between 67° and 125° W longitude. The arrows in Figure 11-3 labeled “Longitude” point to lines of longitude.
Any specific geographical point can be located by reference to its longitude and latitude. Washington, D.C., for example, is approximately 39° N latitude, 77° W longitude. Chicago is approximately 42° N latitude, 88° W longitude.
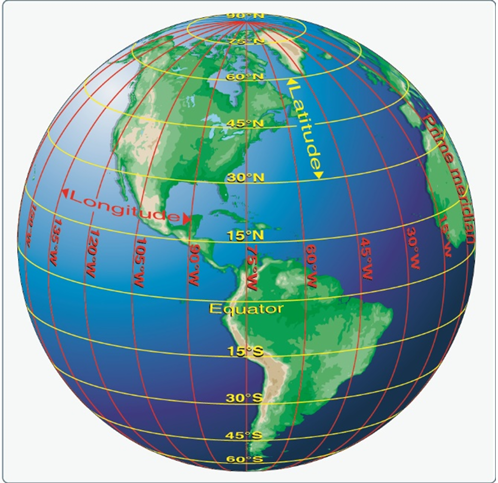
Figure 11-3. Meridians and parallels—the basis of measuring time, distance, and direction.
Variation
Variation is the angle between true north (TN) and magnetic north (MN). It is expressed as east variation or west variation depending upon whether MN is to the east or west of TN.
The north magnetic pole is located close to 71° N latitude, 96° W longitude and is about 1,300 miles from the geographic or true north pole, as indicated in Figure 11-4. If the Earth were uniformly magnetized, the compass needle would point toward the magnetic pole, in which case the variation between TN (as shown by the geographical meridians) and MN (as shown by the magnetic meridians) could be measured at any intersection of the meridians.
Actually, the Earth is not uniformly magnetized. In the United States, the needle usually points in the general direction of the magnetic pole, but it may vary in certain geographical localities by many degrees. Consequently, the exact amount of variation at thousands of selected locations in the United States has been carefully determined. The amount and the direction of variation, which change slightly from time to time, are shown on most aeronautical charts as broken magenta lines called isogonic lines that connect points of equal magnetic variation. (The line connecting points at which there is no variation between TN and MN is the agonic line.) An isogonic chart is shown in Figure 11-5. Minor bends and turns in the isogonic and agonic lines are caused by unusual geological conditions affecting magnetic forces in these areas.
Antenna Towers
Extreme caution should be exercised when flying less than 2,000 feet AGL because of numerous skeletal structures, such as radio and television antenna towers, that exceed 1,000 feet AGL with some
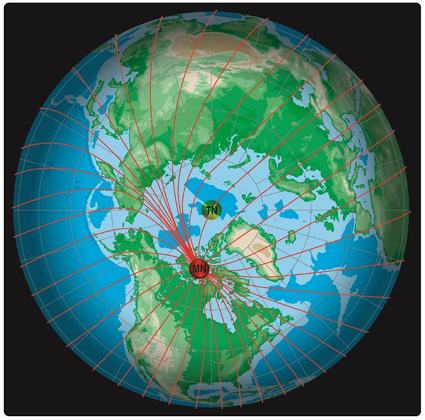
Figure 11-4. Magnetic meridians are in red while the lines of longitude and latitude are in blue. From these lines of variation (magnetic meridians), on can determine the effect of local magnetic variations on a magnetic compass.
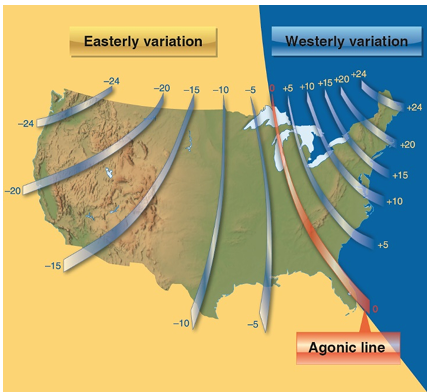
Figure 11-5. Note the agonic line where magnetic variation is zero.
extending higher than 2,000 feet AGL. Most skeletal structures are supported by guy wires which are very difficult to see in good weather and can be invisible at dusk or during periods of reduced visibility. These wires can extend about 1,500 feet horizontally from a structure; therefore, all skeletal structures should be avoided horizontally by at least 2,000 feet.
Additionally, new towers may not be on your current chart because the information was not received prior to the printing of the chart.


